Feedy
Jan. 2019 - May 2020
Ann Arbor, MI, USA
Organization
Pediatric Feeding Disorder Clinic at C.S. Mott Children's Hospital
Team
3 Product Designers, 5 Researchers, 1 Engineer
Role
Product Designer & UX Researcher
Feedy
Jan. 2019 - May 2020
Ann Arbor, MI, USA
Organization
Pediatric Feeding Disorder Clinic at C.S. Mott Children's Hospital
Team
3 Product Designers, 5 Researchers, 1 Engineer
Role
Product Designer & UX Researcher
Feedy
Jan. 2019 - May 2020
Ann Arbor, MI, USA
Organization
Pediatric Feeding Disorder Clinic at C.S. Mott Children's Hospital
Team
3 Product Designers, 5 Researchers, 1 Engineer
Role
Product Designer & UX Researcher
Feedy
Jan. 2019 - May 2020
Ann Arbor, MI, USA
Organization
Pediatric Feeding Disorder Clinic at C.S. Mott Children's Hospital
Team
3 Product Designers, 5 Researchers, 1 Engineer
Role
Product Designer & UX Researcher


Overview
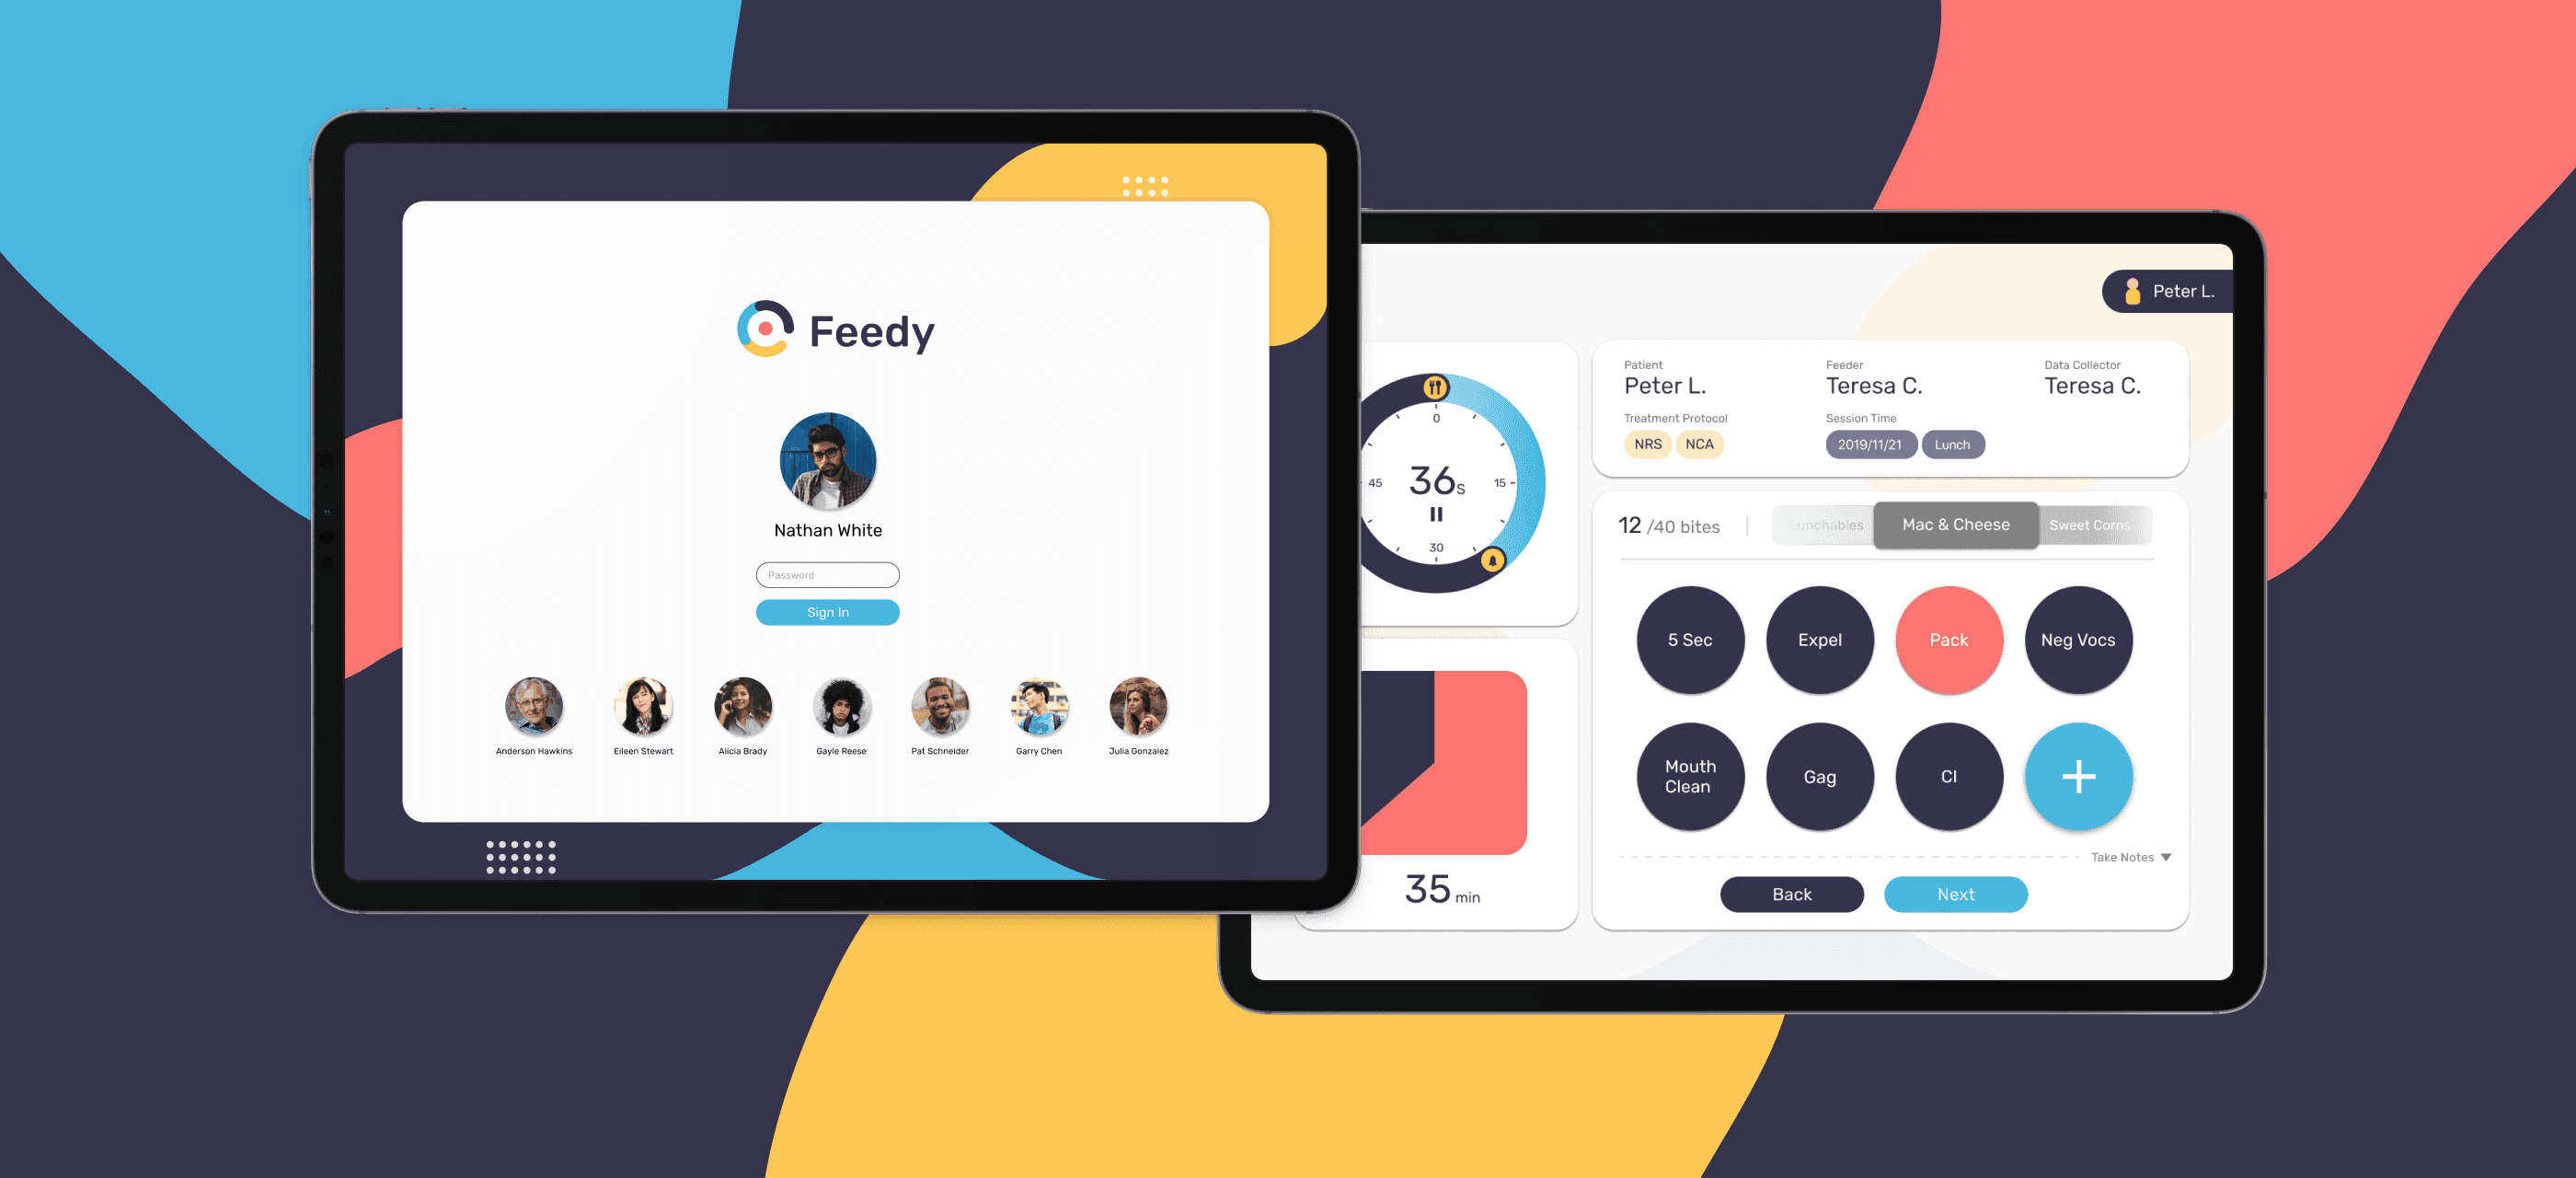
Behavior technicians at the Pediatric Feeding Disorder Clinic at C.S. Mott Children's Hospital experience taxing workloads during feeding sessions, including feeding the patient, collecting behavioral data, and manually transferring data from paper-based collection sheets to the computer and the EHR system afterwards. Inefficiencies in both session and post-session tasks limits the clinic’s ability to provide service to more patients.
Our project goal is to explore solutions to increase their working routine efficiency and help the clinic scale up their service to more patients in need. With the help of Feedy, clinicians would be able to seamlessly manage the flow of patient data, ease their physical and mental burden during feeding sessions and share information with patients’ caregivers more easily.
Project Highlights
In this project, I worked both on research and product design. I led the initial user research, including drafting interview protocols, conducting interviews and observations with clinicians, and synthesizing the qualitative data we collected. In the design phase, I worked with 2 other designers to implement design decisions based on our research insights and delivered both wireframes and hi-fi mockups for further development.
We also submitted our preliminary research paper and got accepted by WISH@CHI 2019 and Proceedings of the ACM on Human-Computer Interaction in 2021.
Final Design
Final Design
Optimizing The Data Collection Process
The design aims to match with clinicians' current practice using paper-based data collection sheet, indicating feeding progress, upcoming food choice, and session data. During feeding sessions, clinicians can easily use simple taps to mark the observed behaviors and add notes to document details.


Customization Matters
Treatment varies hugely by patient and progress and targeting behaviors to observe or document can be really different. Feedy retains the flexibility of collecting data with papers, allowing users to easily add observing criteria before or even during feeding sessions.
Customization Matters
Treatment varies hugely by patient and progress and targeting behaviors to observe or document can be really different. Feedy retains the flexibility of collecting data with papers, allowing users to easily add observing criteria before or even during feeding sessions.
Customization Matters
Treatment varies hugely by patient and progress and targeting behaviors to observe or document can be really different. Feedy retains the flexibility of collecting data with papers, allowing users to easily add observing criteria before or even during feeding sessions.


Never Forget To Set Any Timers
Both break timer and analog timer plays a critical role during sessions: break time is a key factor in Applied Behavior Analysis(ABA) and the analog timer allows young patients to get a sense of the remaining session time. Once finishing collecting data, Feedy would automatically set the break timer for you and present the analog timer in full screen when not in use.


Understand Patient Data At A Glance
The text-based data makes it hard for clinicians to share progress with caregivers or even among the clinic. Feedy utilizes the behavioral data collected and instantly transforms it into visualized graphs for better communication purposes and better comprehension of patients' progress.


Design Process
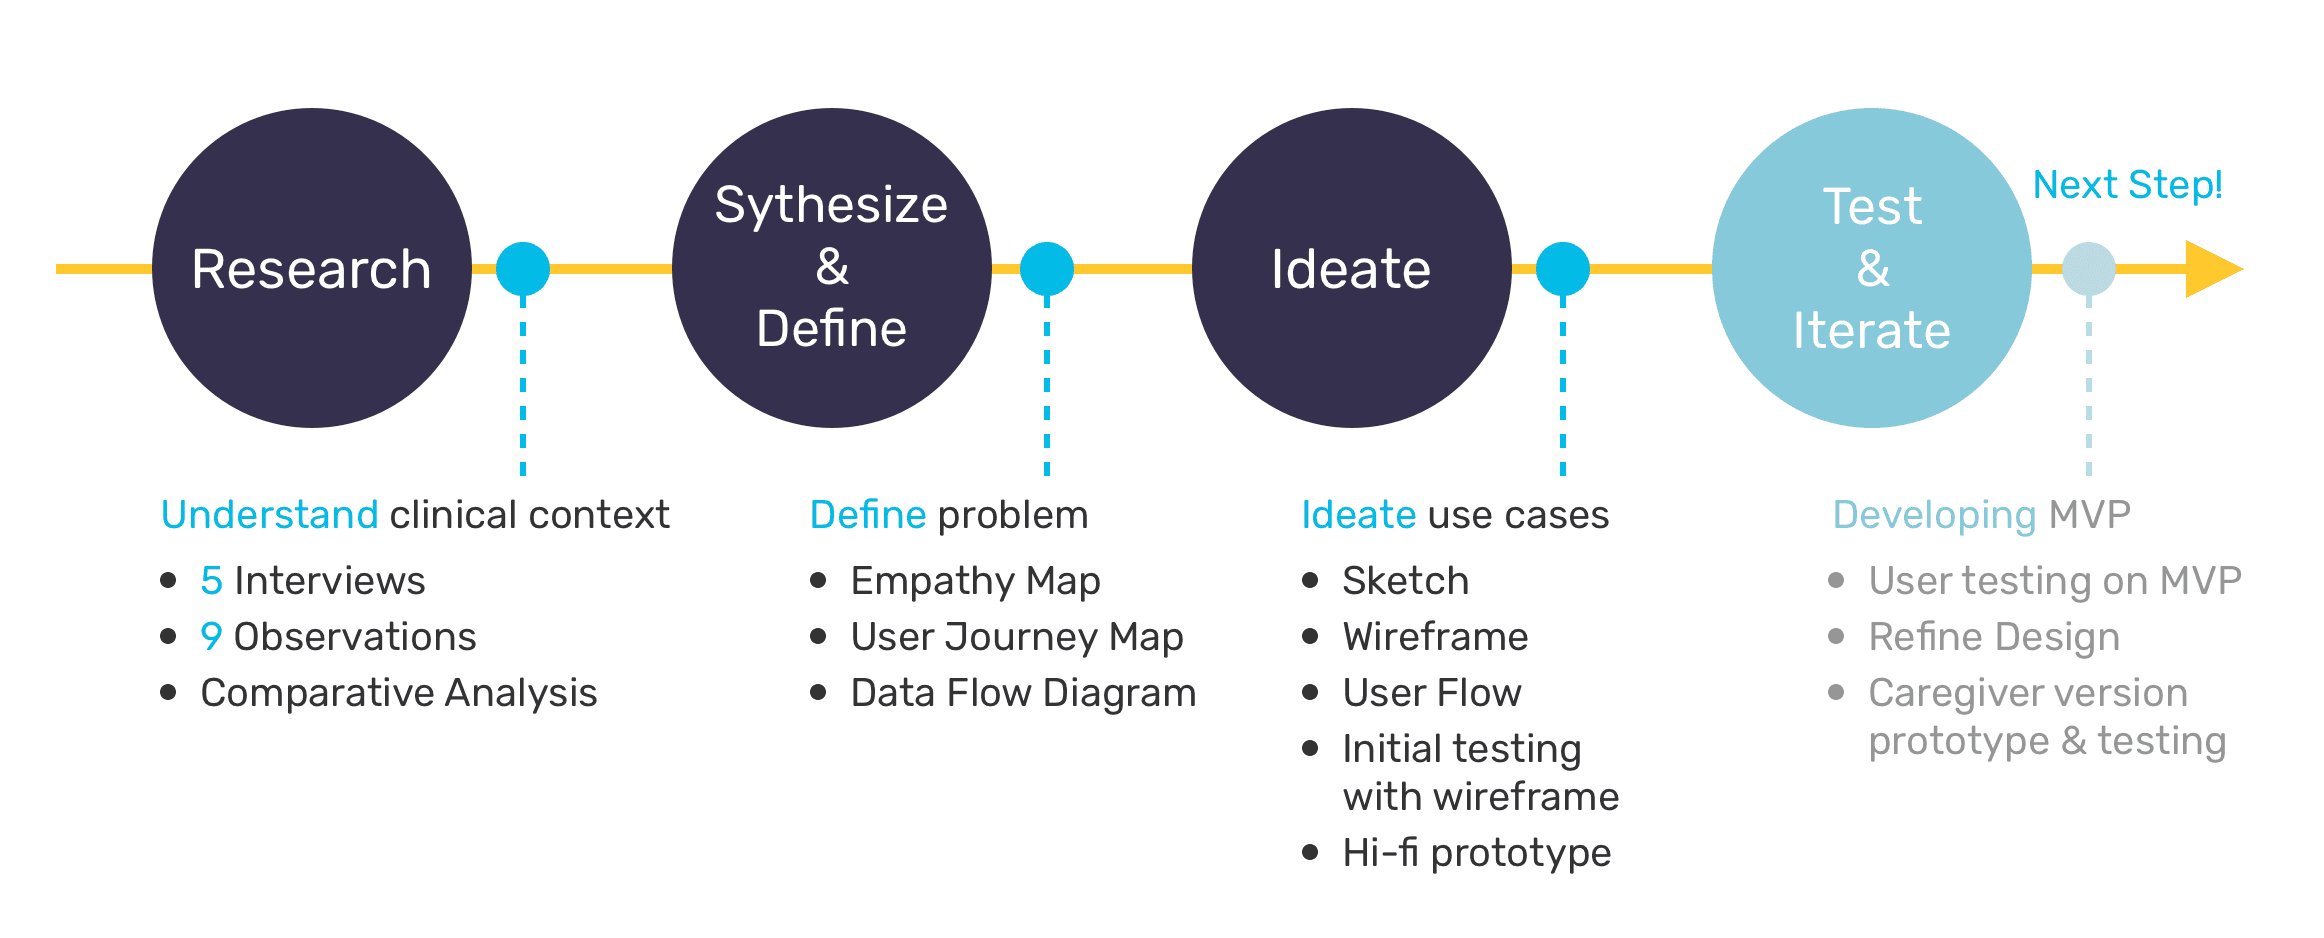
We have completed researching, synthesizing qualitative data we obtained, ideating with potential solutions and narrowing down our solution to tablet-based application. We have done initial testings and the next step is to conduct further user testings after our MVP is developed.
Design Process
We have completed researching, synthesizing qualitative data we obtained, ideating with potential solutions and narrowing down our solution to tablet-based application. We have done initial testings and the next step is to conduct further user testings after our MVP is developed.
Design Process
We have completed researching, synthesizing qualitative data we obtained, ideating with potential solutions and narrowing down our solution to tablet-based application. We have done initial testings and the next step is to conduct further user testings after our MVP is developed.

Research
In the initial research process, we chose to use semi-structured interviews and observations for feeding sessions to obtain in-depth understanding of the clinical context and current working practices.
Research
In the initial research process, we chose to use semi-structured interviews and observations for feeding sessions to obtain in-depth understanding of the clinical context and current working practices.
Research
In the initial research process, we chose to use semi-structured interviews and observations for feeding sessions to obtain in-depth understanding of the clinical context and current working practices.
5 Semi-Structured Interviews
We interviewed with 1 psychologist, 1 dietician, 1 language pathologist and 2 behavior technicians to get an in-depth understanding of their working practices.
5 Semi-Structured Interviews
We interviewed with 1 psychologist, 1 dietician, 1 language pathologist and 2 behavior technicians to get an in-depth understanding of their working practices.
5 Semi-Structured Interviews
We interviewed with 1 psychologist, 1 dietician, 1 language pathologist and 2 behavior technicians to get an in-depth understanding of their working practices.
9 Observations Of Feeding Sessions
The purpose of the observation is to understand the pain points and design opportunities during feeding sessions and data management process.
9 Observations Of Feeding Sessions
The purpose of the observation is to understand the pain points and design opportunities during feeding sessions and data management process.
9 Observations Of Feeding Sessions
The purpose of the observation is to understand the pain points and design opportunities during feeding sessions and data management process.
Context Of Feeding Sessions
Current behavioral data collection is conducted by clinicians by documenting food presented, food weight, treatment protocols, observed behavior results and additional notes on a paper-based collection sheet.
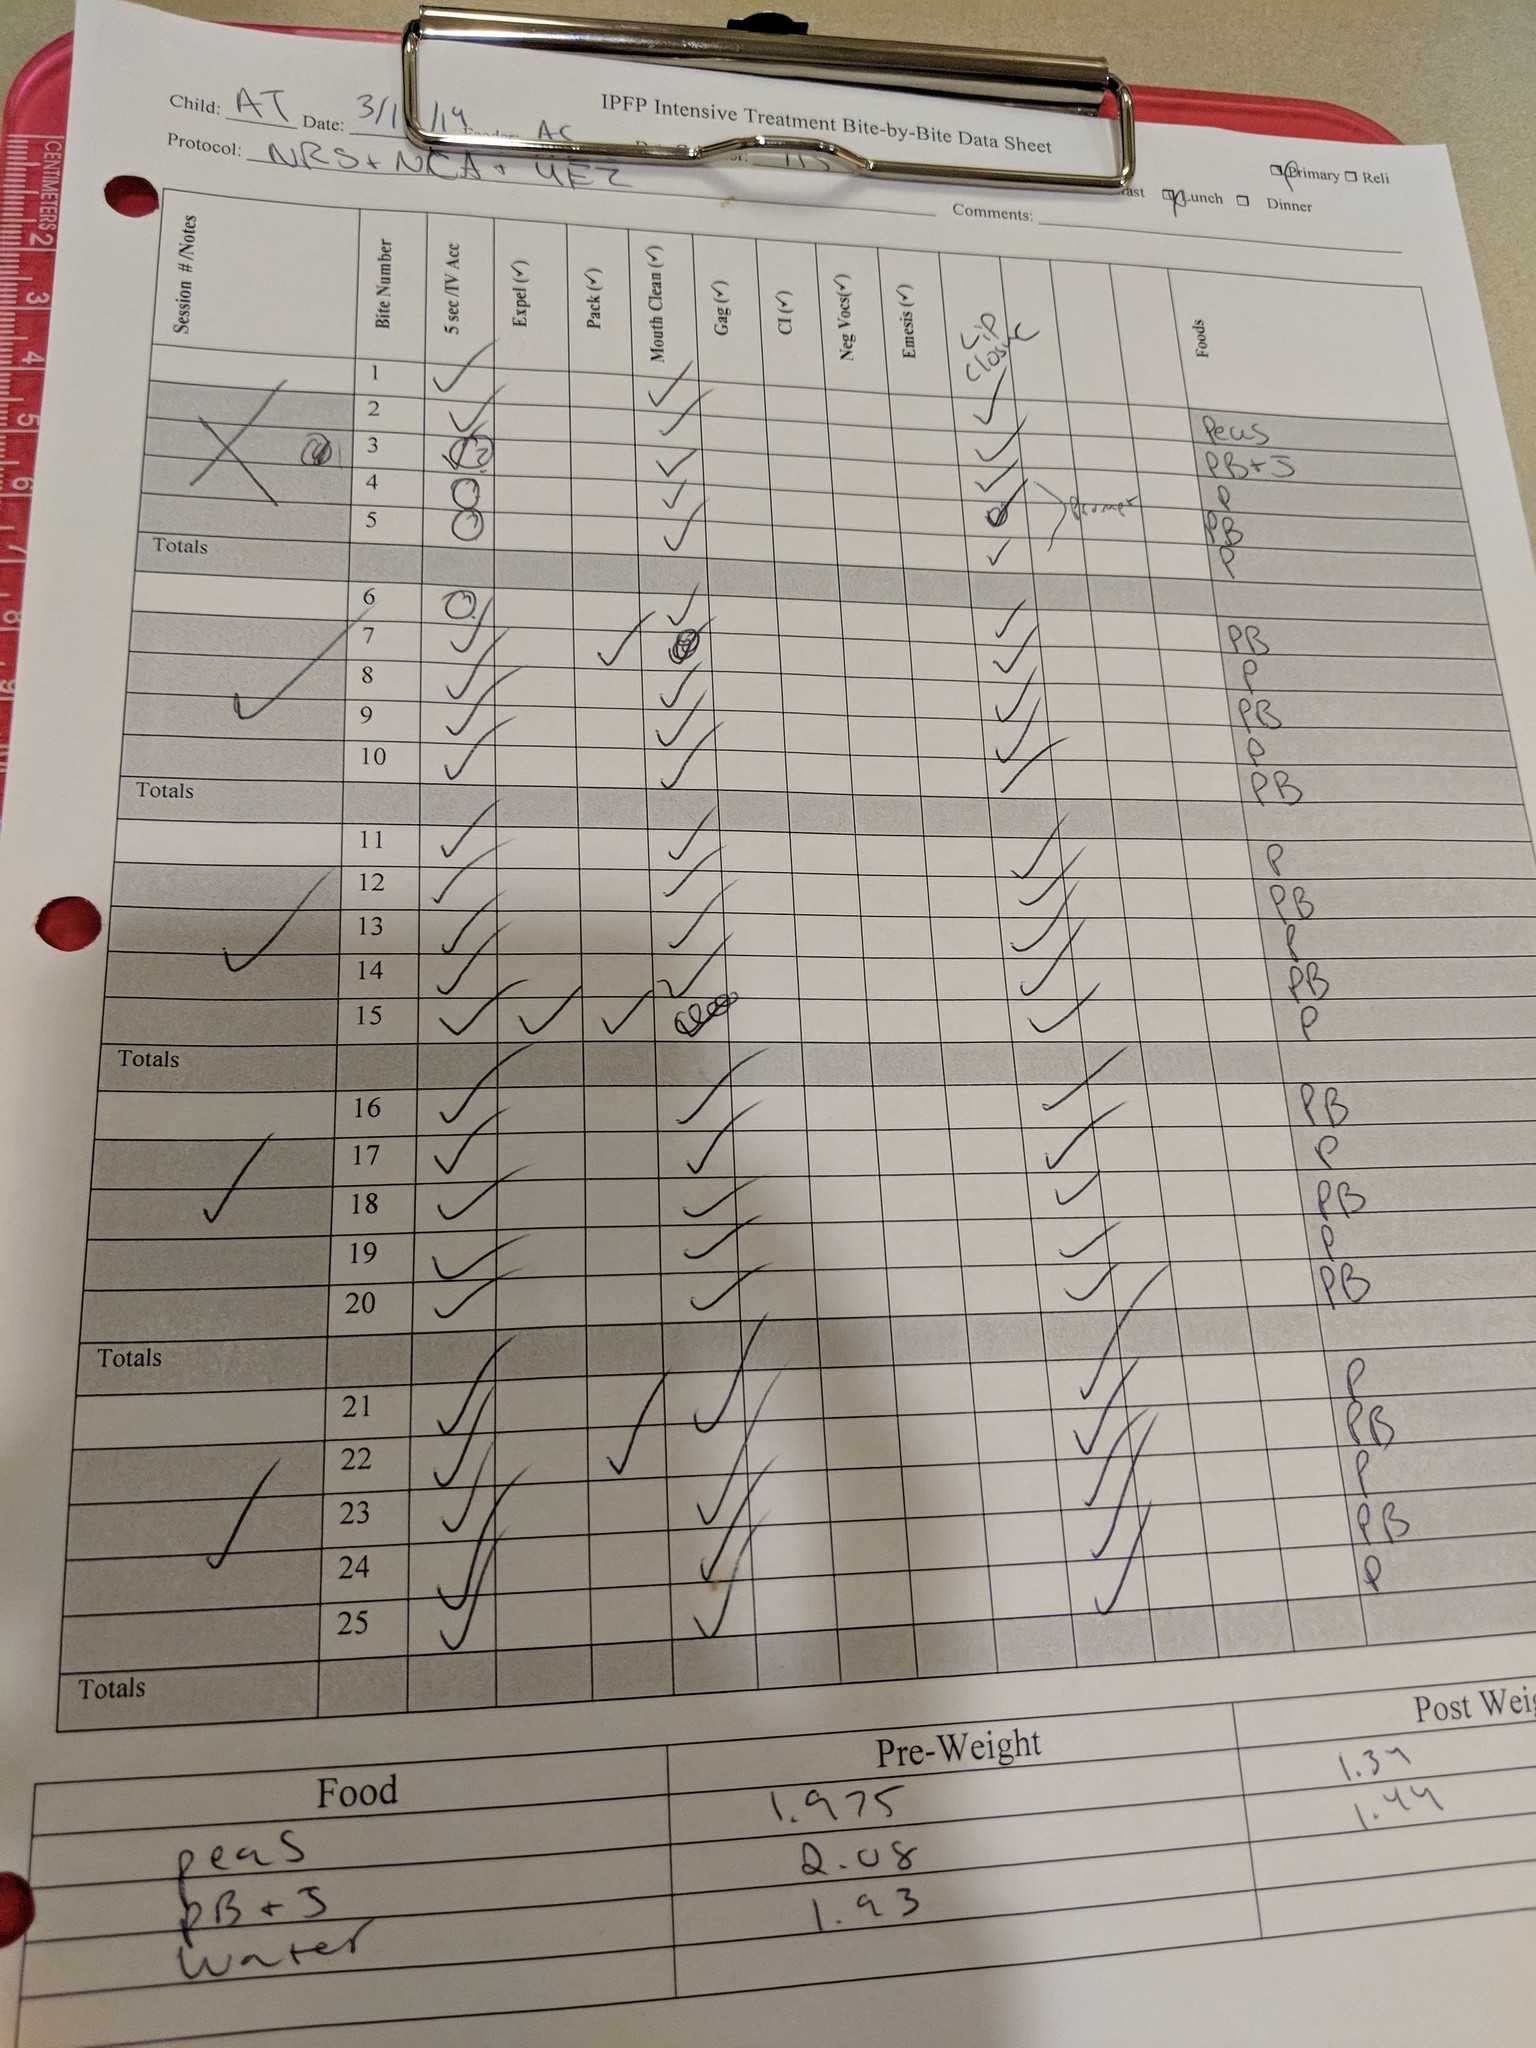
Context Of Feeding Sessions
Current behavioral data collection is conducted by clinicians by documenting food presented, food weight, treatment protocols, observed behavior results and additional notes on a paper-based collection sheet.

Context Of Feeding Sessions
Current behavioral data collection is conducted by clinicians by documenting food presented, food weight, treatment protocols, observed behavior results and additional notes on a paper-based collection sheet.

Synthesize & Define
Turning Qualitative Data Into Insights & Define Design Problems
After acquiring qualitative data from interviews and observations, we chose to use empathy mapping, user journey mapping and a diagram of data flow to distill insights and opportunities that can be further focused on while designing. These methods helps us to quickly grasp our target user's critical needs and pain points and understand how data is collected and transferred throughout the session.
Empathy Map
Our team identified external factors during the feeding session which can affect clinicians and found out clinicians’ pain points and needs for data collection.
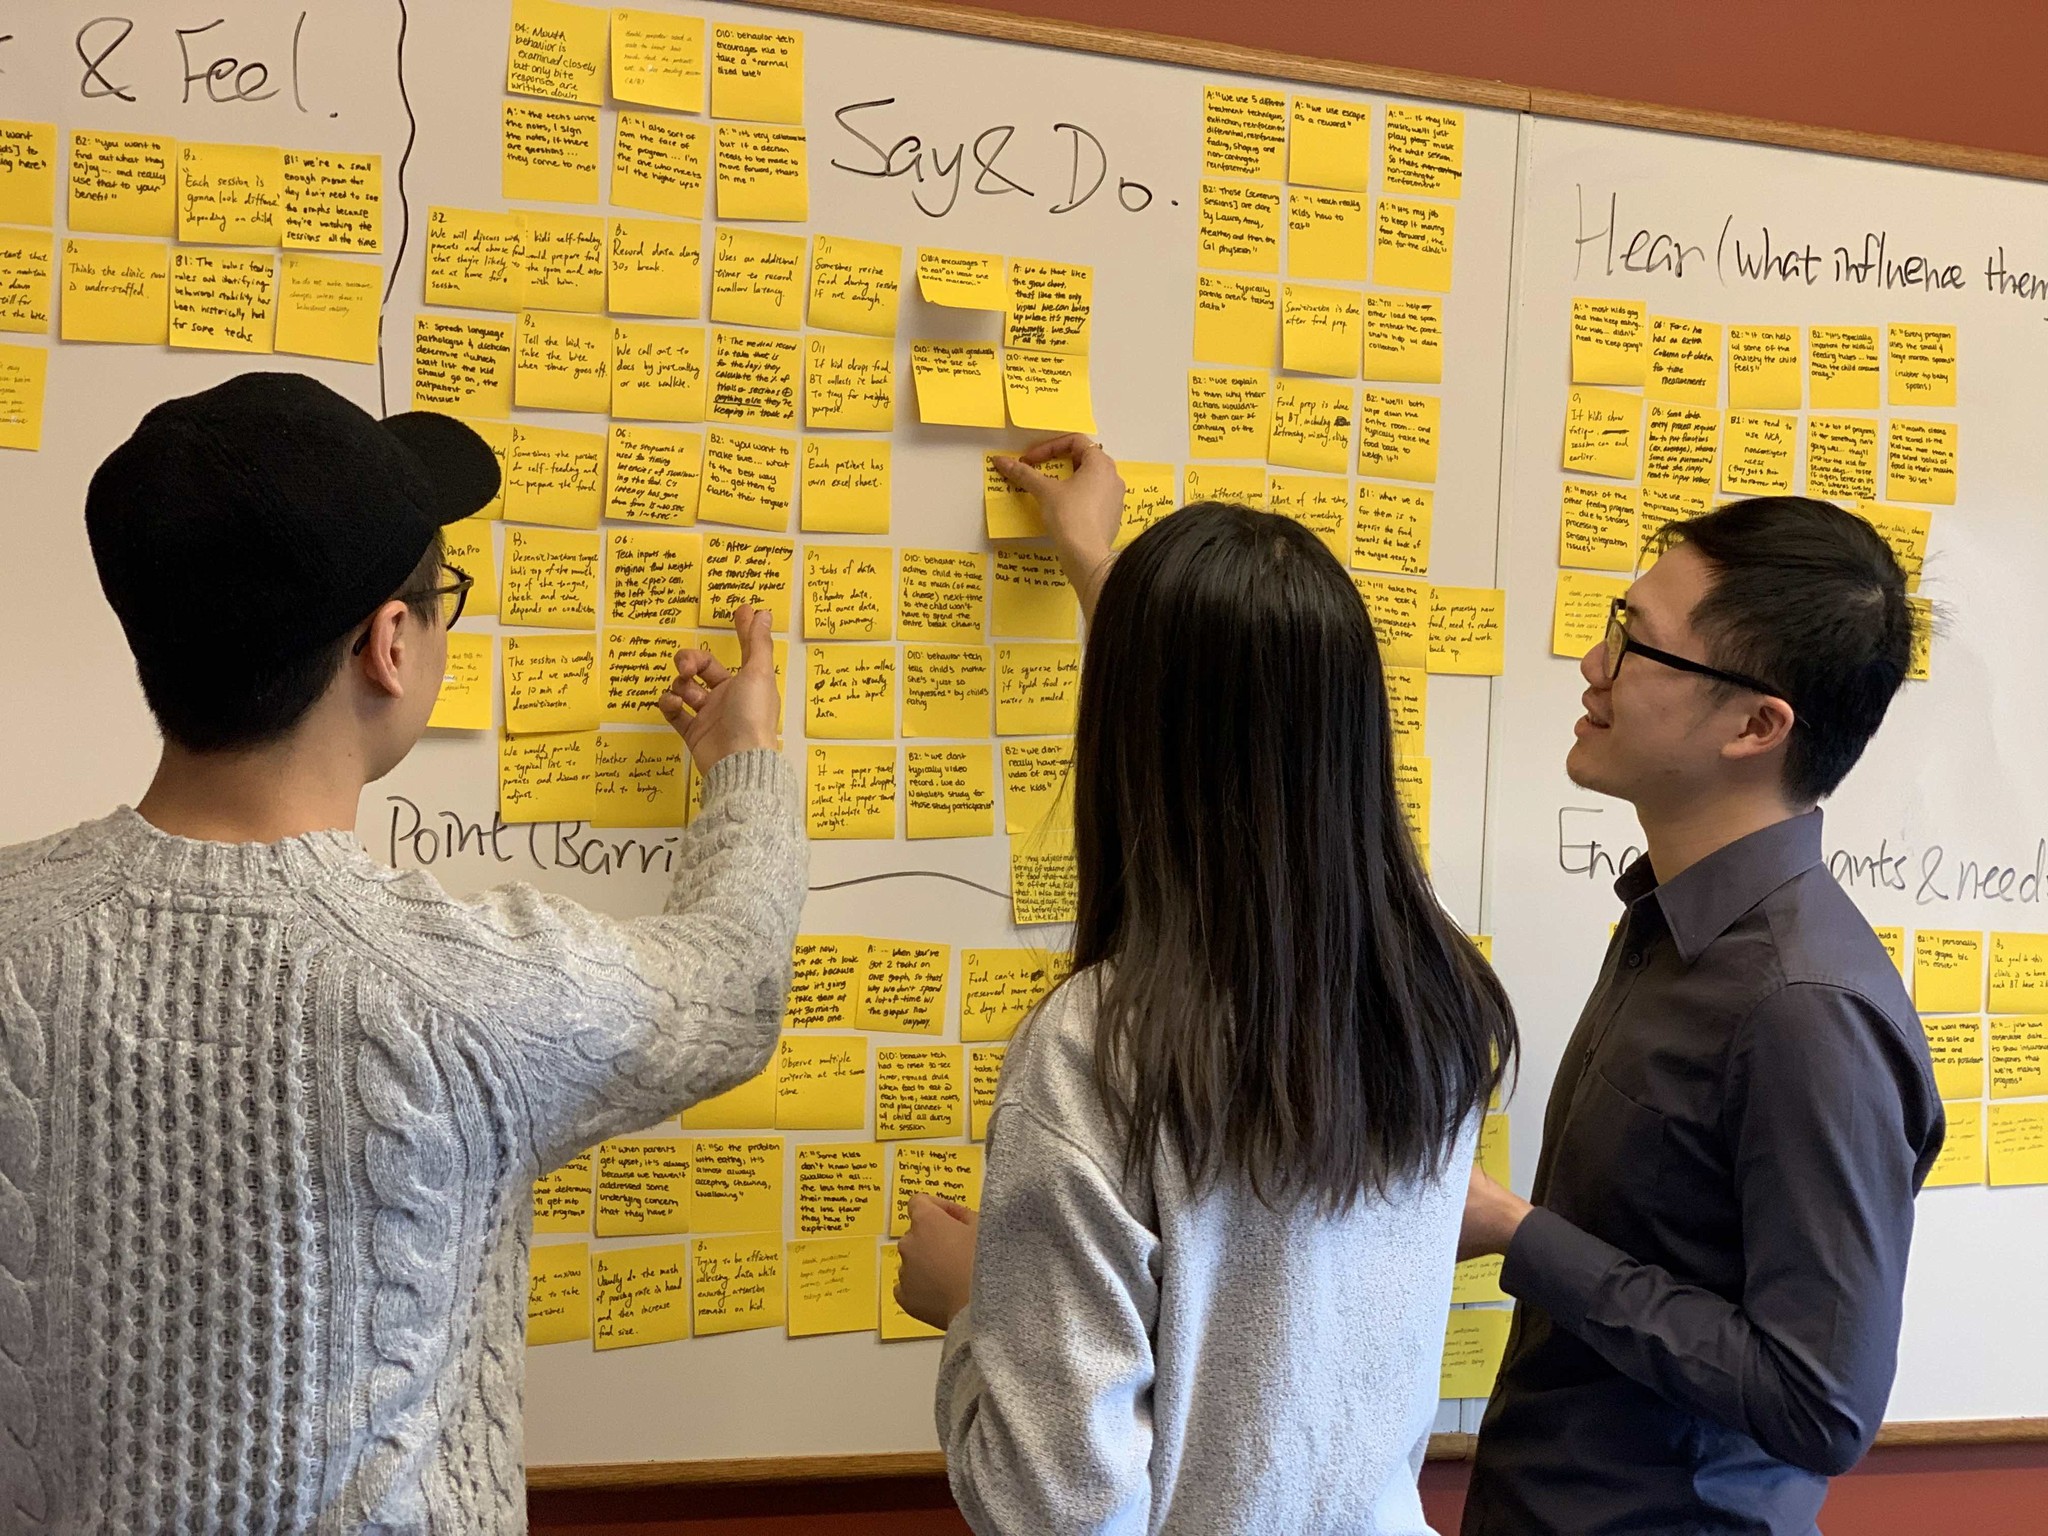
Empathy Map
Our team identified external factors during the feeding session which can affect clinicians and found out clinicians’ pain points and needs for data collection.

Empathy Map
Our team identified external factors during the feeding session which can affect clinicians and found out clinicians’ pain points and needs for data collection.

User Journey Map
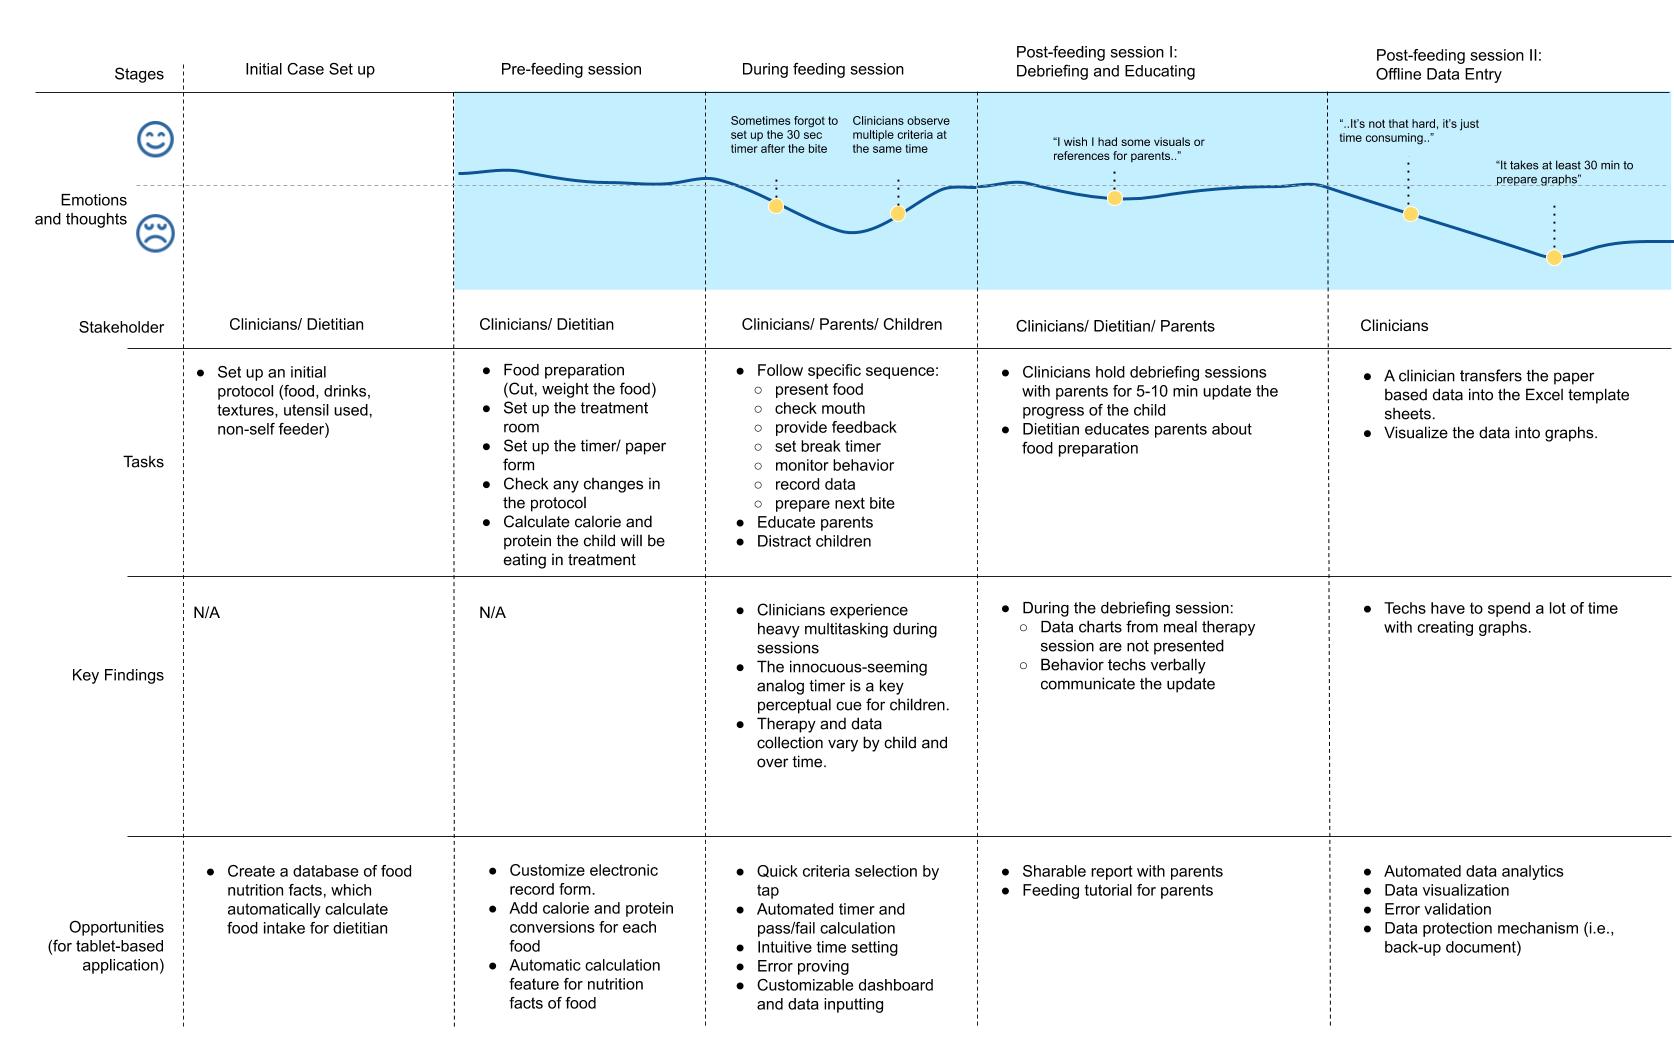
We also build a user journey map of how clinicians operates the feeding sessions and collect data. This helped us visualizes how clinicians interact with the current session artifacts and discover potential design opportunities.
User Journey Map
We also build a user journey map of how clinicians operates the feeding sessions and collect data. This helped us visualizes how clinicians interact with the current session artifacts and discover potential design opportunities.
User Journey Map
We also build a user journey map of how clinicians operates the feeding sessions and collect data. This helped us visualizes how clinicians interact with the current session artifacts and discover potential design opportunities.

Data Flow Diagram
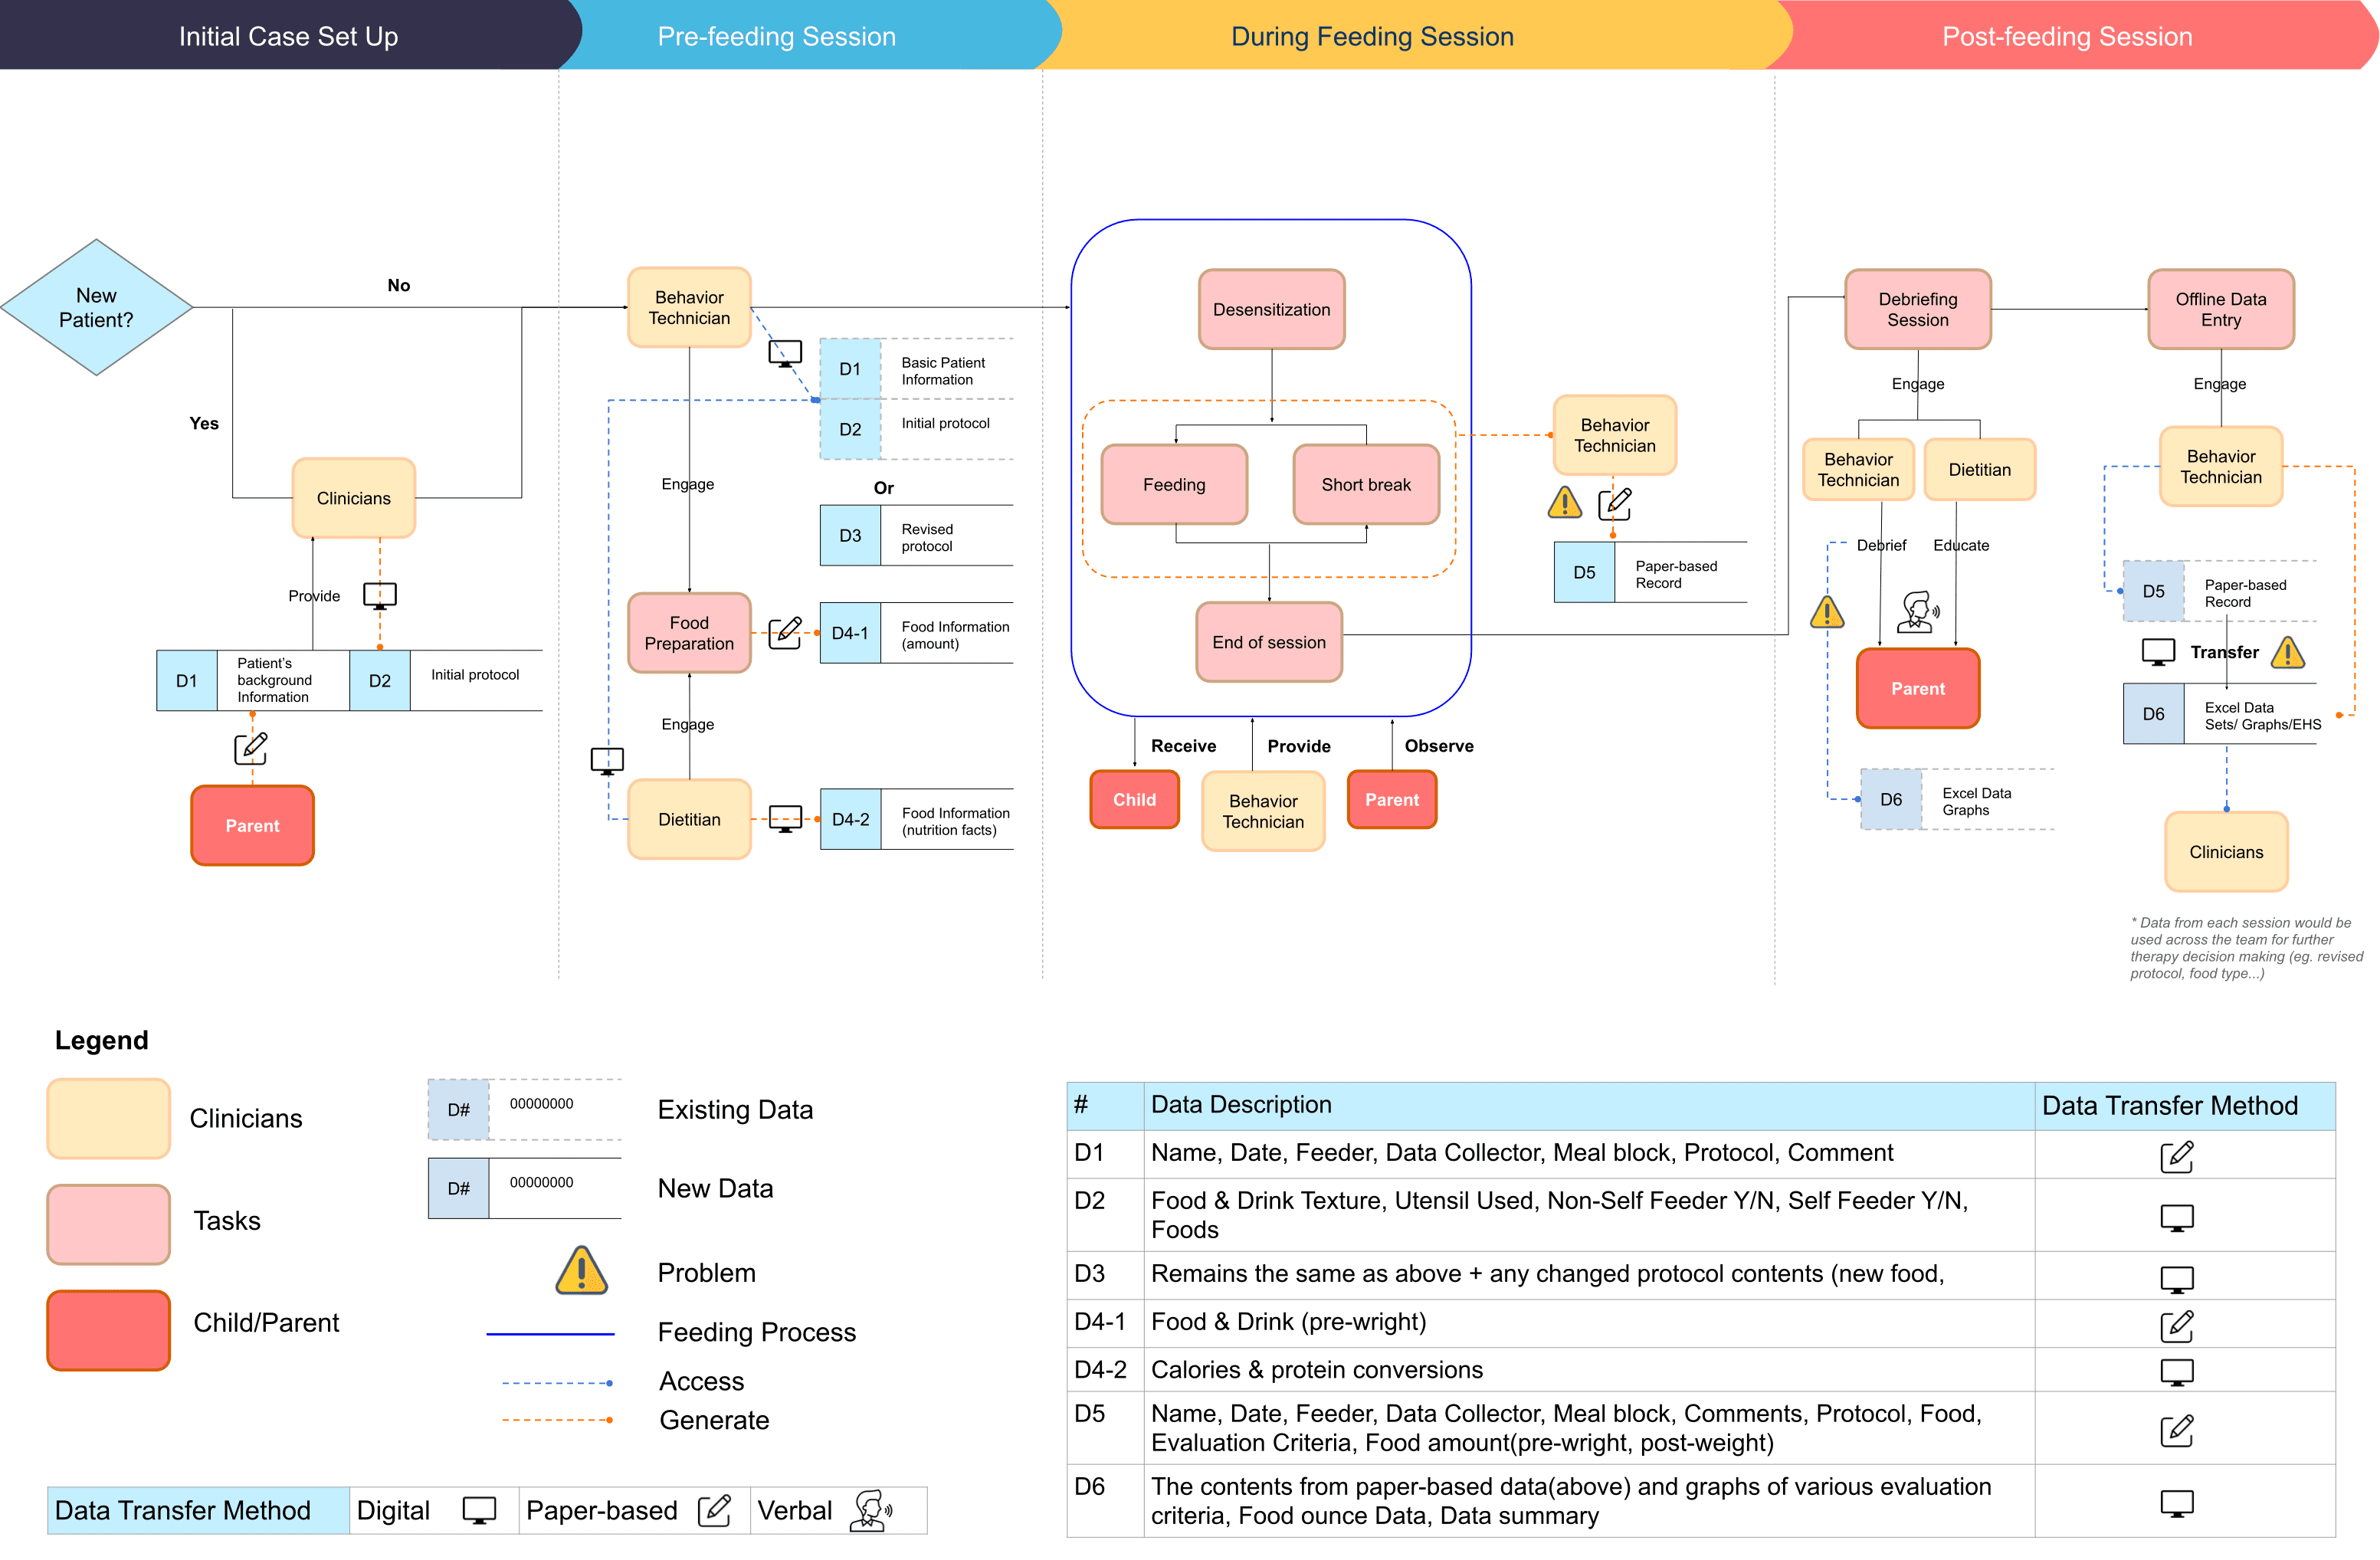
To understand how patient-related data is collected and transferred among the clinicians and what tools are been used to facilitate the data collection and transfer process, we created a data flow diagram to help us view the clinical context from a holistic aspect and identify potential problems.

Findings
After synthesizing qualitative data, we came up with 5 critical findings that should guide the direction of our future solution.
Findings
After synthesizing qualitative data, we came up with 5 critical findings that should guide the direction of our future solution.
Findings
After synthesizing qualitative data, we came up with 5 critical findings that should guide the direction of our future solution.
1
Significant Needs In Digitizing The Data Collection Process
Frequent multitasking and manual data entry for clinicians limits the ability of the clinic to scale its service while maintaining quality to more patients in need.
Frequent multitasking and manual data entry for clinicians limits the ability of the clinic to scale its service while maintaining quality to more patients in need.
1
Significant Needs In Digitizing The Data Collection Process
Frequent multitasking and manual data entry for clinicians limits the ability of the clinic to scale its service while maintaining quality to more patients in need.
1
Significant Needs In Digitizing The Data Collection Process
Frequent multitasking and manual data entry for clinicians limits the ability of the clinic to scale its service while maintaining quality to more patients in need.
2
Significant Needs In Digitizing The Data Collection Process
It's difficult to standardize data collection into a single rubric. Therefore, customization of the data collection is critical to cope with each patient's case.
Frequent multitasking and manual data entry for clinicians limits the ability of the clinic to scale its service while maintaining quality to more patients in need.
2
Significant Needs In Digitizing The Data Collection Process
Frequent multitasking and manual data entry for clinicians limits the ability of the clinic to scale its service while maintaining quality to more patients in need.
2
Significant Needs In Digitizing The Data Collection Process
Frequent multitasking and manual data entry for clinicians limits the ability of the clinic to scale its service while maintaining quality to more patients in need.
3
The Need For Visualized Data Instead Of Sheets And Tables
The break timer is critical in ABA practices but due to taxing workloads, clinicians will sometimes forget to set the timer. The analog clock-faced timer also plays a critical role as a visual reminder for children.
Frequent multitasking and manual data entry for clinicians limits the ability of the clinic to scale its service while maintaining quality to more patients in need.
3
The Need For Visualized Data Instead Of Sheets And Tables
Frequent multitasking and manual data entry for clinicians limits the ability of the clinic to scale its service while maintaining quality to more patients in need.
3
The Need For Visualized Data Instead Of Sheets And Tables
Frequent multitasking and manual data entry for clinicians limits the ability of the clinic to scale its service while maintaining quality to more patients in need.
4
The Need For Visualized Data Instead Of Sheets And Tables
The need for visualized data is not only for better information retrieval but also for clinicians to share patient progress more easily among the clinic or even with caregivers.
Frequent multitasking and manual data entry for clinicians limits the ability of the clinic to scale its service while maintaining quality to more patients in need.
4
The Need For Visualized Data Instead Of Sheets And Tables
Frequent multitasking and manual data entry for clinicians limits the ability of the clinic to scale its service while maintaining quality to more patients in need.
4
The Need For Visualized Data Instead Of Sheets And Tables
Frequent multitasking and manual data entry for clinicians limits the ability of the clinic to scale its service while maintaining quality to more patients in need.
5
Information Gap Between Clinicians And Caregivers
Currently data from home-feeding meals is not documented and clinicians reported the need for understanding patients' progress at home to help them better track feeding behaviors
Frequent multitasking and manual data entry for clinicians limits the ability of the clinic to scale its service while maintaining quality to more patients in need.
5
Information Gap Between Clinicians And Caregivers
Frequent multitasking and manual data entry for clinicians limits the ability of the clinic to scale its service while maintaining quality to more patients in need.
5
Information Gap Between Clinicians And Caregivers
Frequent multitasking and manual data entry for clinicians limits the ability of the clinic to scale its service while maintaining quality to more patients in need.
Ideation & Design
Ideation & Design
Ideation & Design
Sketch
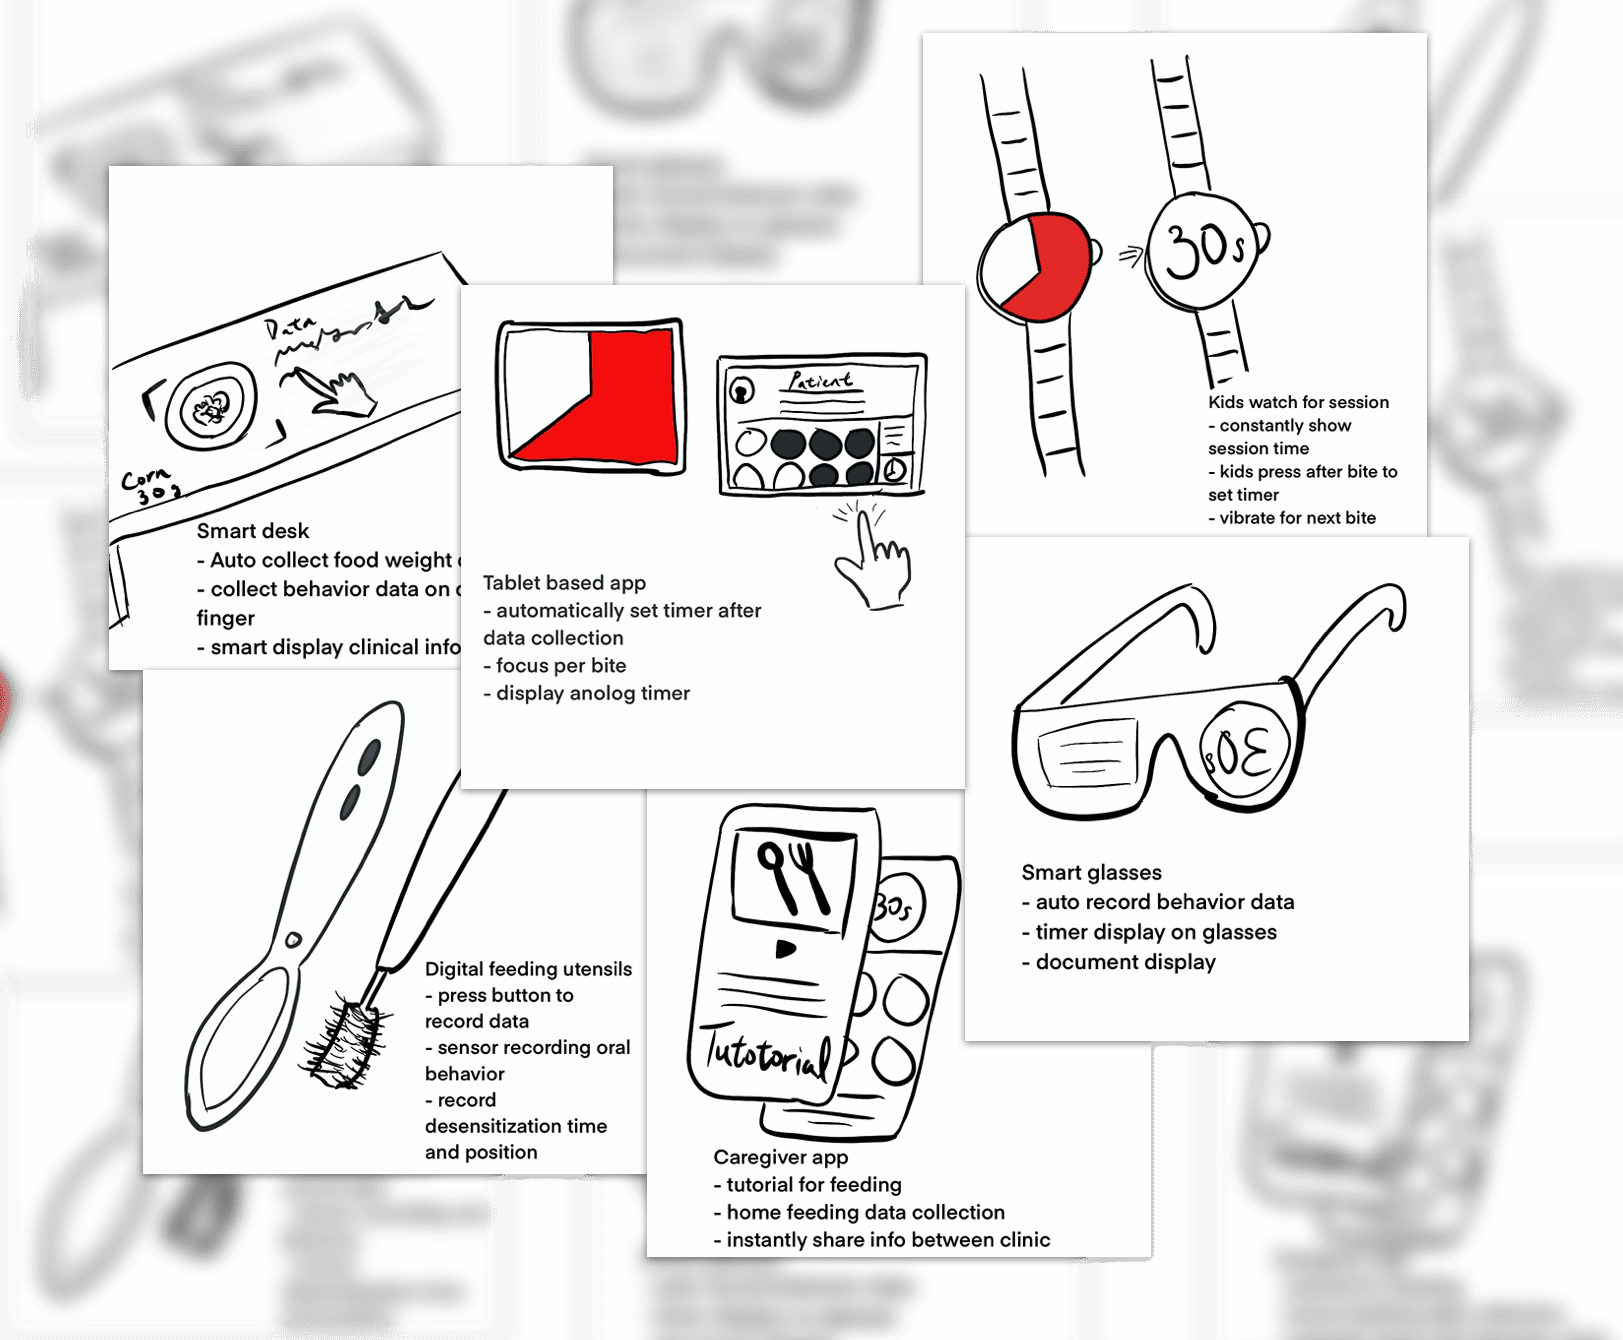
Based off of our findings and the pain points we discovered from our research, we used sketching to diverge with potential solutions that meet our users' needs.
Sketch
Based off of our findings and the pain points we discovered from our research, we used sketching to diverge with potential solutions that meet our users' needs.
Sketch
Based off of our findings and the pain points we discovered from our research, we used sketching to diverge with potential solutions that meet our users' needs.

Presenting Ideations To Clinicians & Feedback
After discussing with the clinicians and obtaining feedbacks, the clinicians and the team decided to narrow down the solution scope and focus on designing a digitized data collection tool on tablet devices, which are already common devices currently being used during sessions.

Form Design Rationale
After synthesizing research findings, we formed the overarching design rationale that will guide our design team throughout the following design process and inform our design decisions:
Form Design Rationale
After synthesizing research findings, we formed the overarching design rationale that will guide our design team throughout the following design process and inform our design decisions:
Form Design Rationale
After synthesizing research findings, we formed the overarching design rationale that will guide our design team throughout the following design process and inform our design decisions:

Easy to adapt
The solution should share familiarity with how current artifacts are being used to reduce additional learning curves.

Easy to adapt
The solution should share familiarity with how current artifacts are being used to reduce additional learning curves.

Easy to adapt
The solution should share familiarity with how current artifacts are being used to reduce additional learning curves.

Consistent with current practice
Although the solution is in a digitized form, it should still follow current clinical practices and include the tools required.

Consistent with current practice
Although the solution is in a digitized form, it should still follow current clinical practices and include the tools required.

Consistent with current practice
Although the solution is in a digitized form, it should still follow current clinical practices and include the tools required.

Inclusive for all users
The solution should be inclusive for all types of users considering that there are different roles in the clinic as well as caregivers.

Inclusive for all users
The solution should be inclusive for all types of users considering that there are different roles in the clinic as well as caregivers.

Inclusive for all users
The solution should be inclusive for all types of users considering that there are different roles in the clinic as well as caregivers.
Wireframe & Initial User Testings
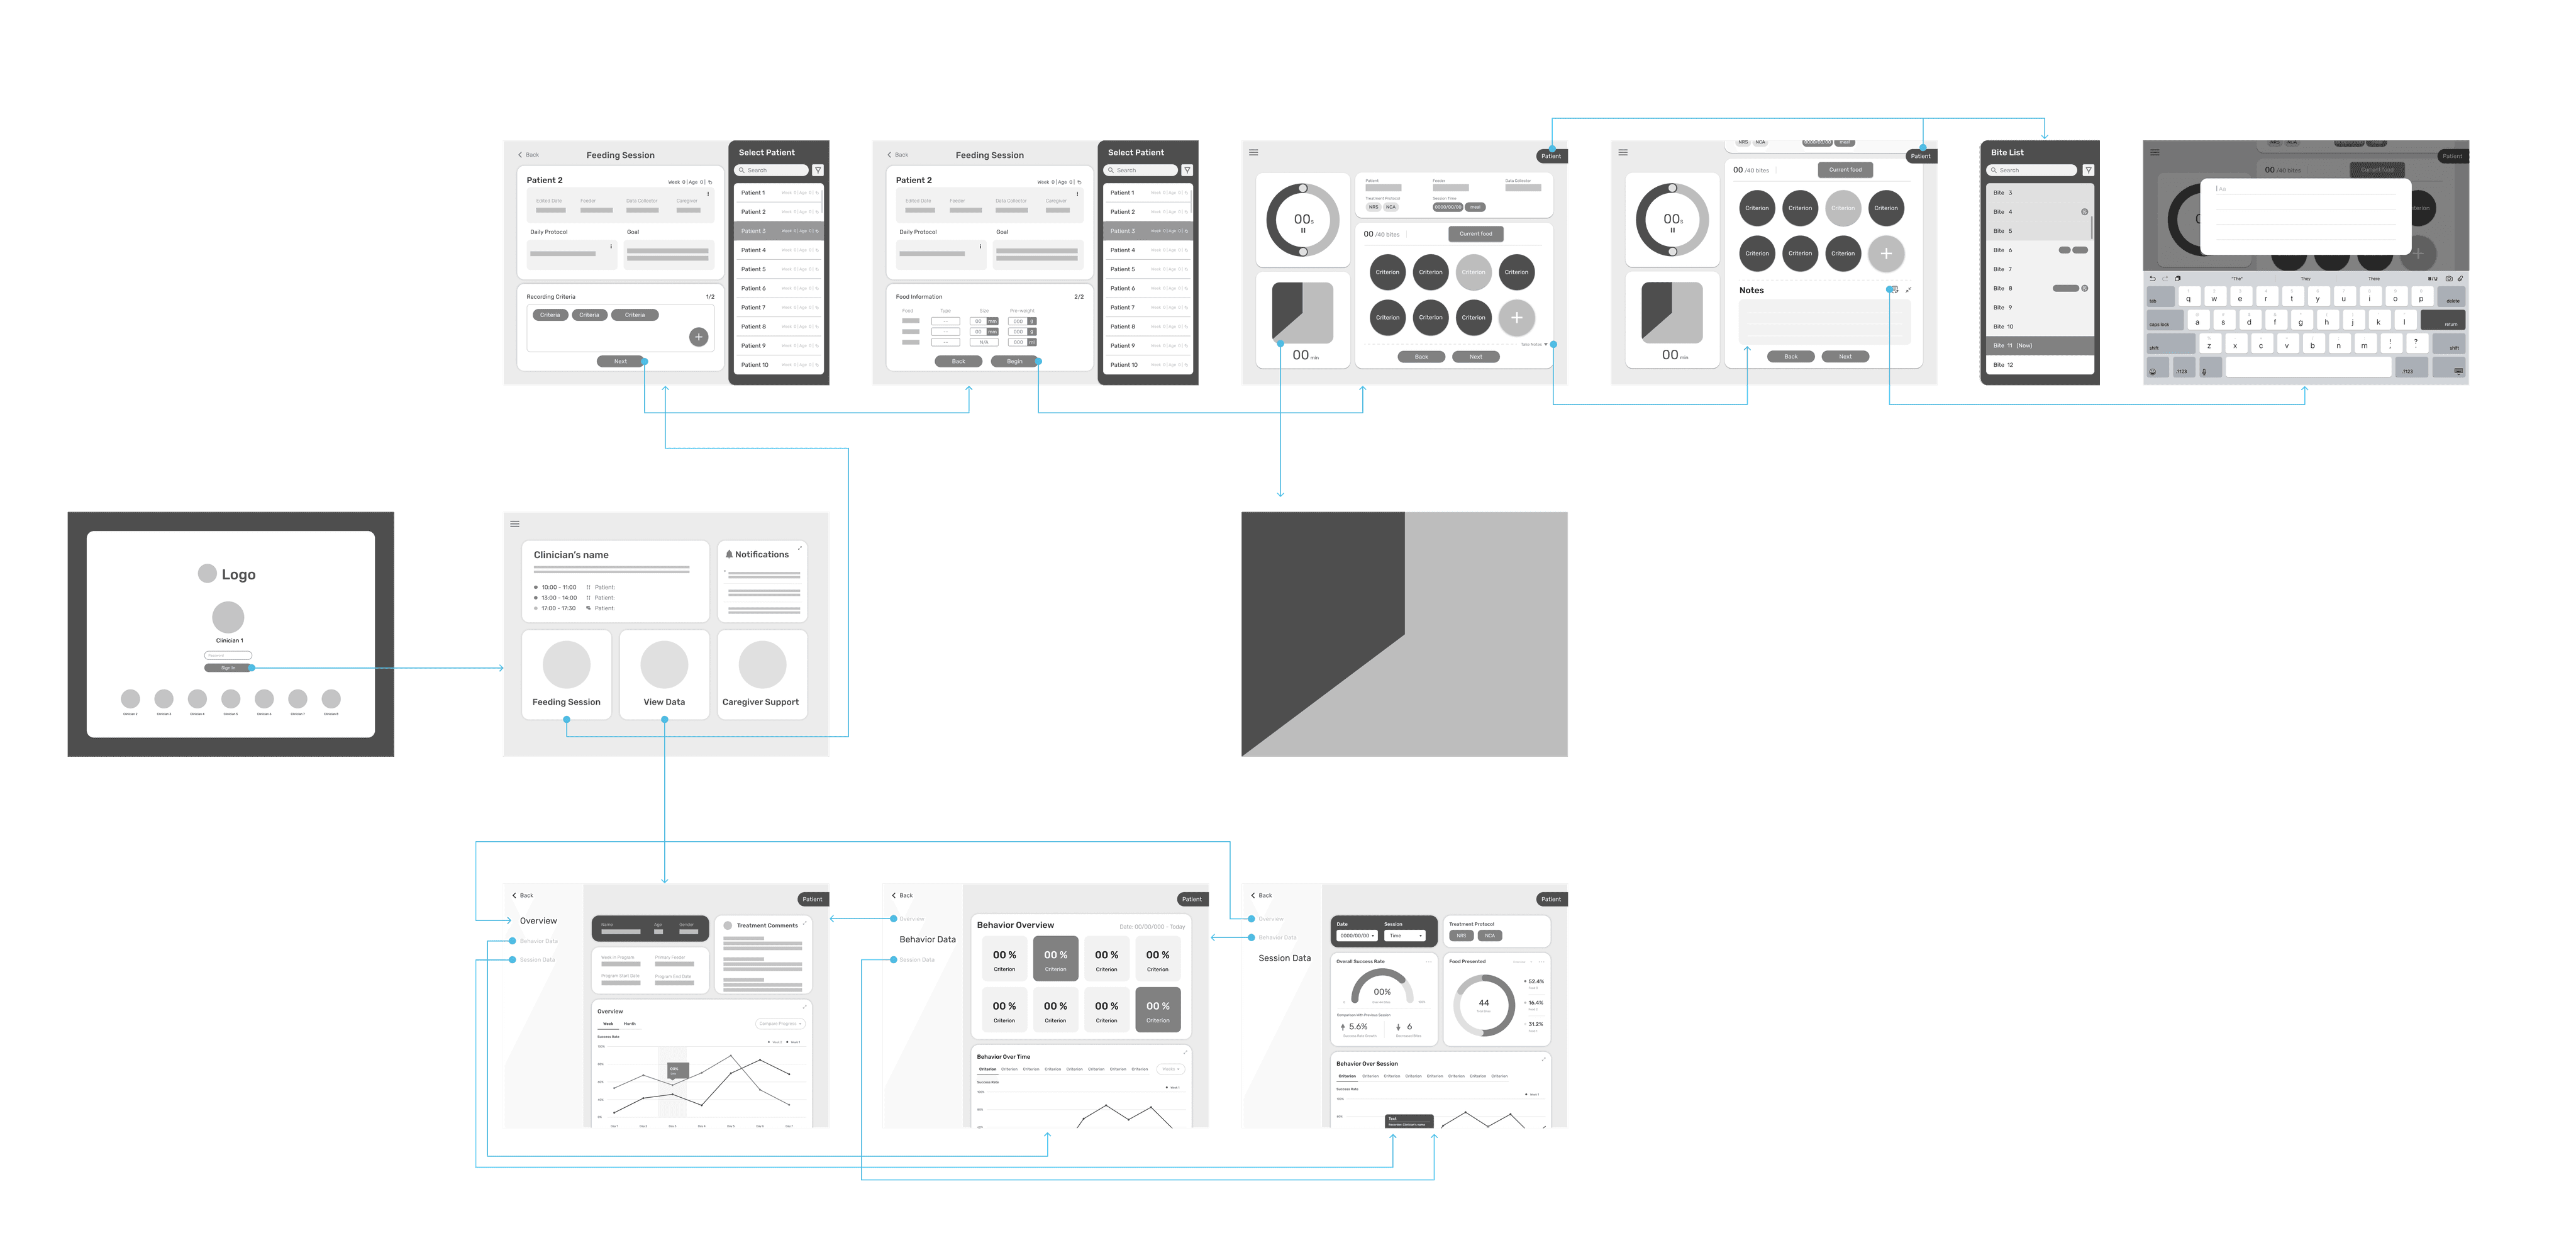
After we have focused our solution to a tablet-based application, we designed an initial version wireframes based on our findings and design rationales. Over the summer of 2019, one of our designer used the wireframes to conduct an initial user testing with the clinicians and gathered feedback for our future revised prototypes.

Design Guidelines
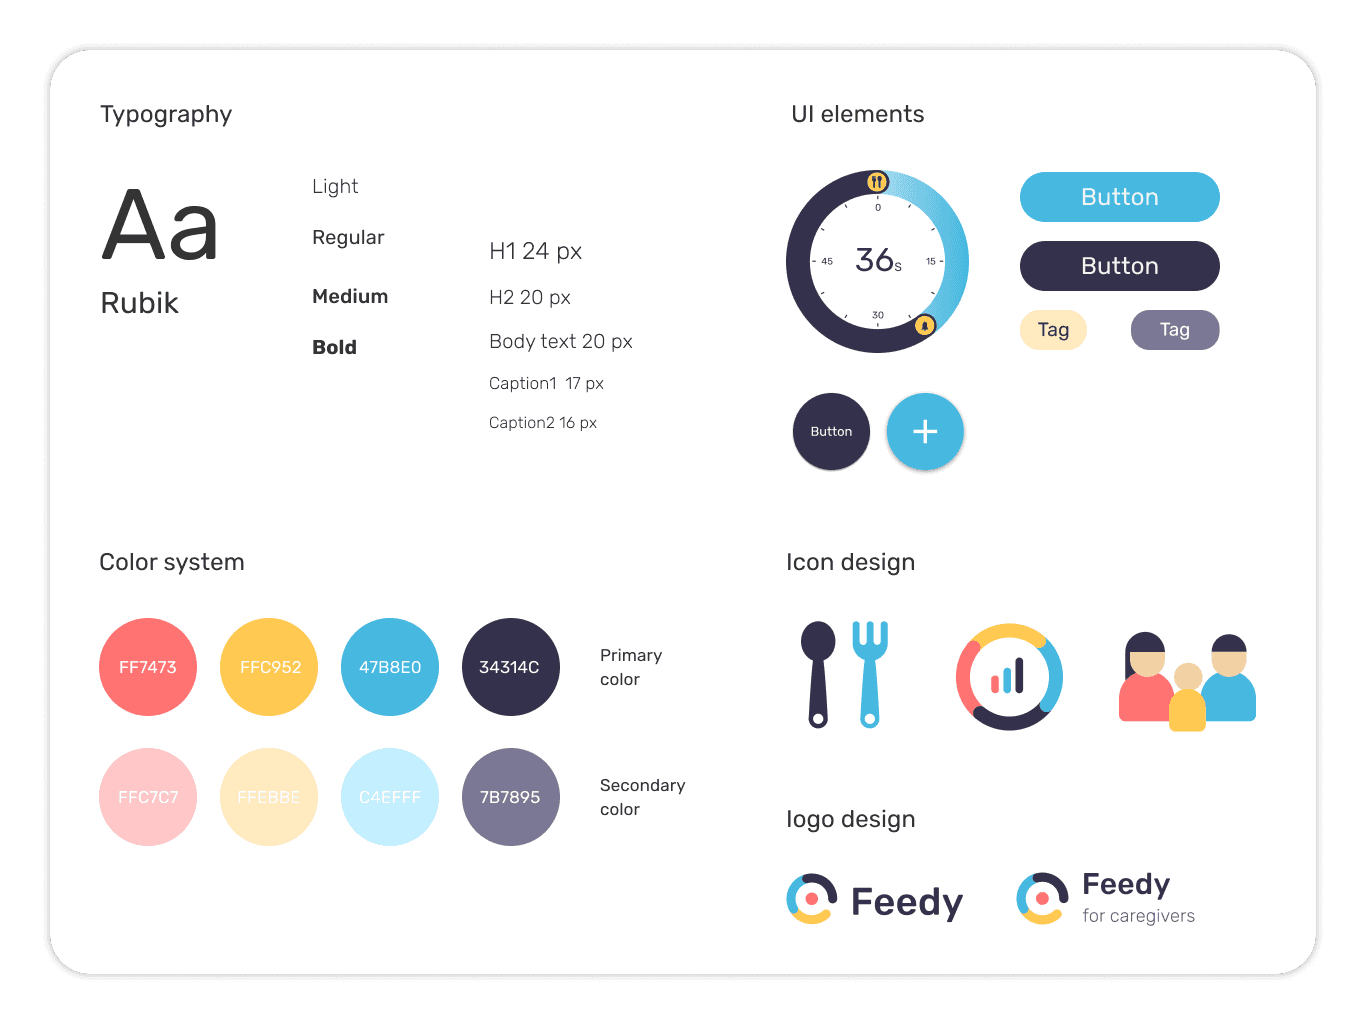
Before jumping into designing hi-fi mockups for the app, we first created a design guideline including fonts, color pallets, icons, logos and even some basic UI elements. Building a guideline before designing helped 3 designers in the team to effectively distribute design workloads and reduce collaboration design issues.
Before jumping into designing hi-fi mockups for the app, we first created a design guideline including fonts, color pallets, icons, logos and even some basic UI elements. Building a guideline before designing helped 3 designers in the team to effectively distribute design workloads and reduce collaboration design issues.
Design Guidelines
Before jumping into designing hi-fi mockups for the app, we first created a design guideline including fonts, color pallets, icons, logos and even some basic UI elements. Building a guideline before designing helped 3 designers in the team to effectively distribute design workloads and reduce collaboration design issues.

Final Design Mockups
Final Design Mockups
Final Design Mockups
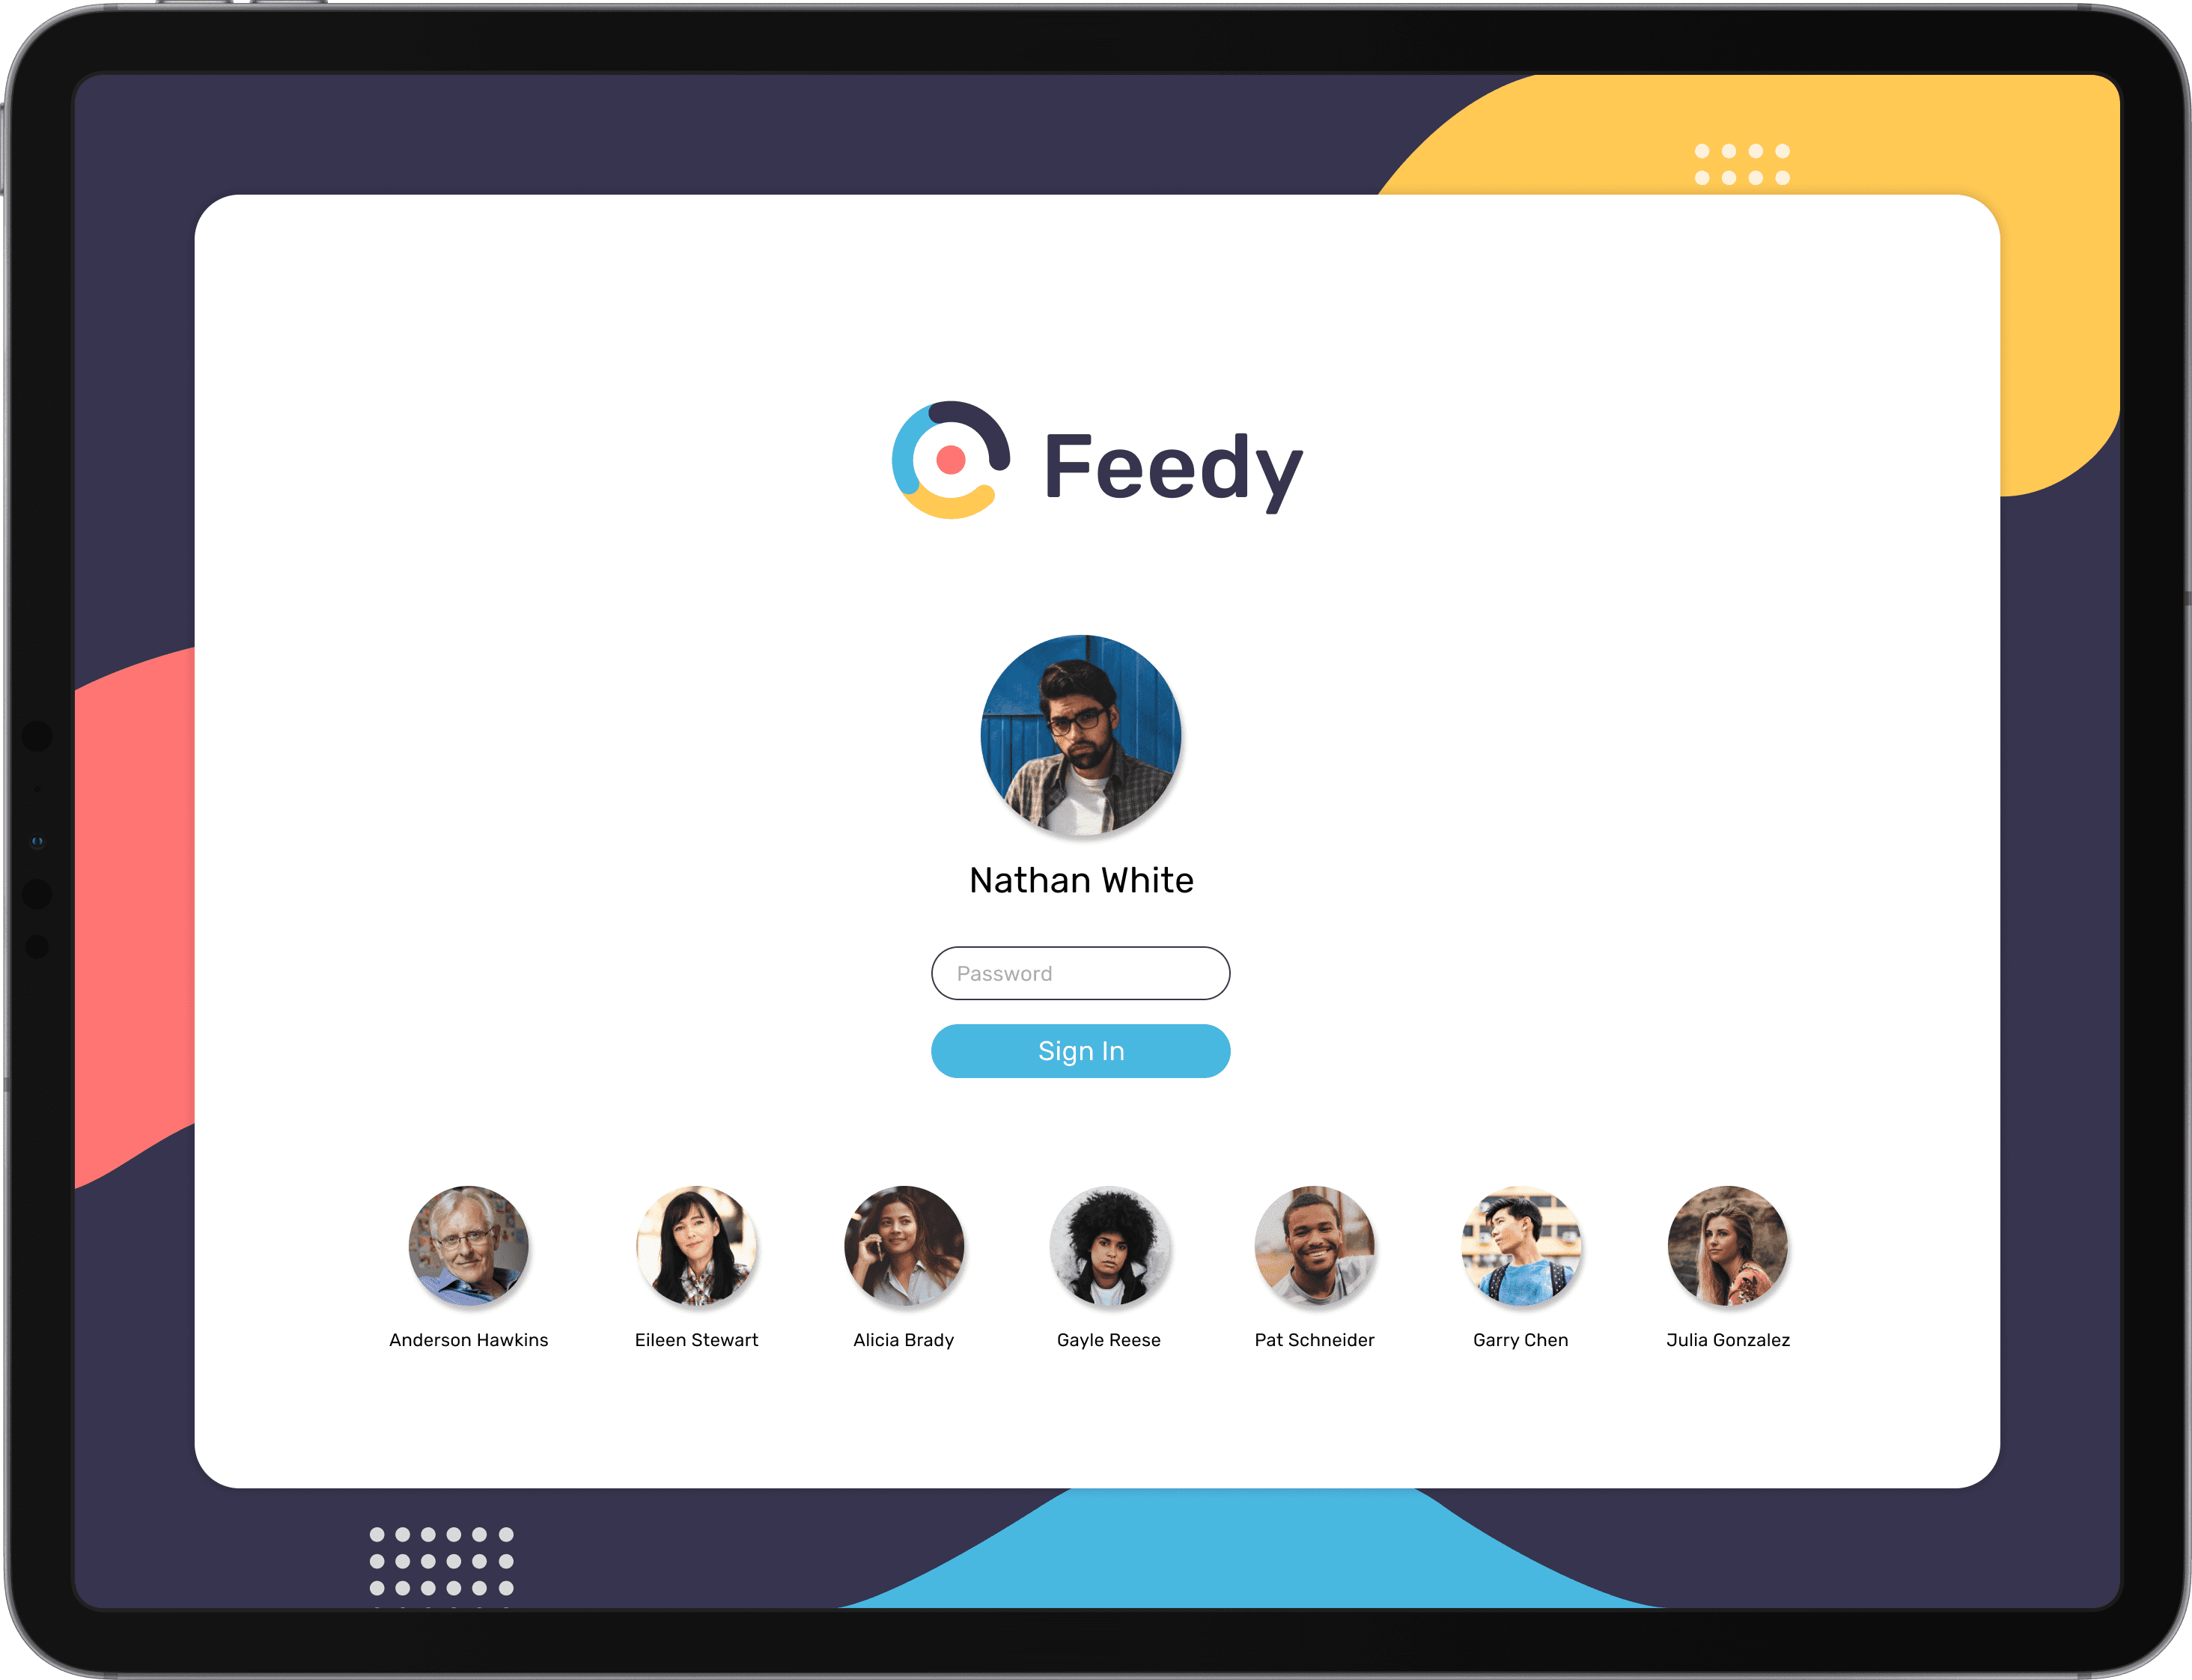
Login Page

Login Page

Login Page
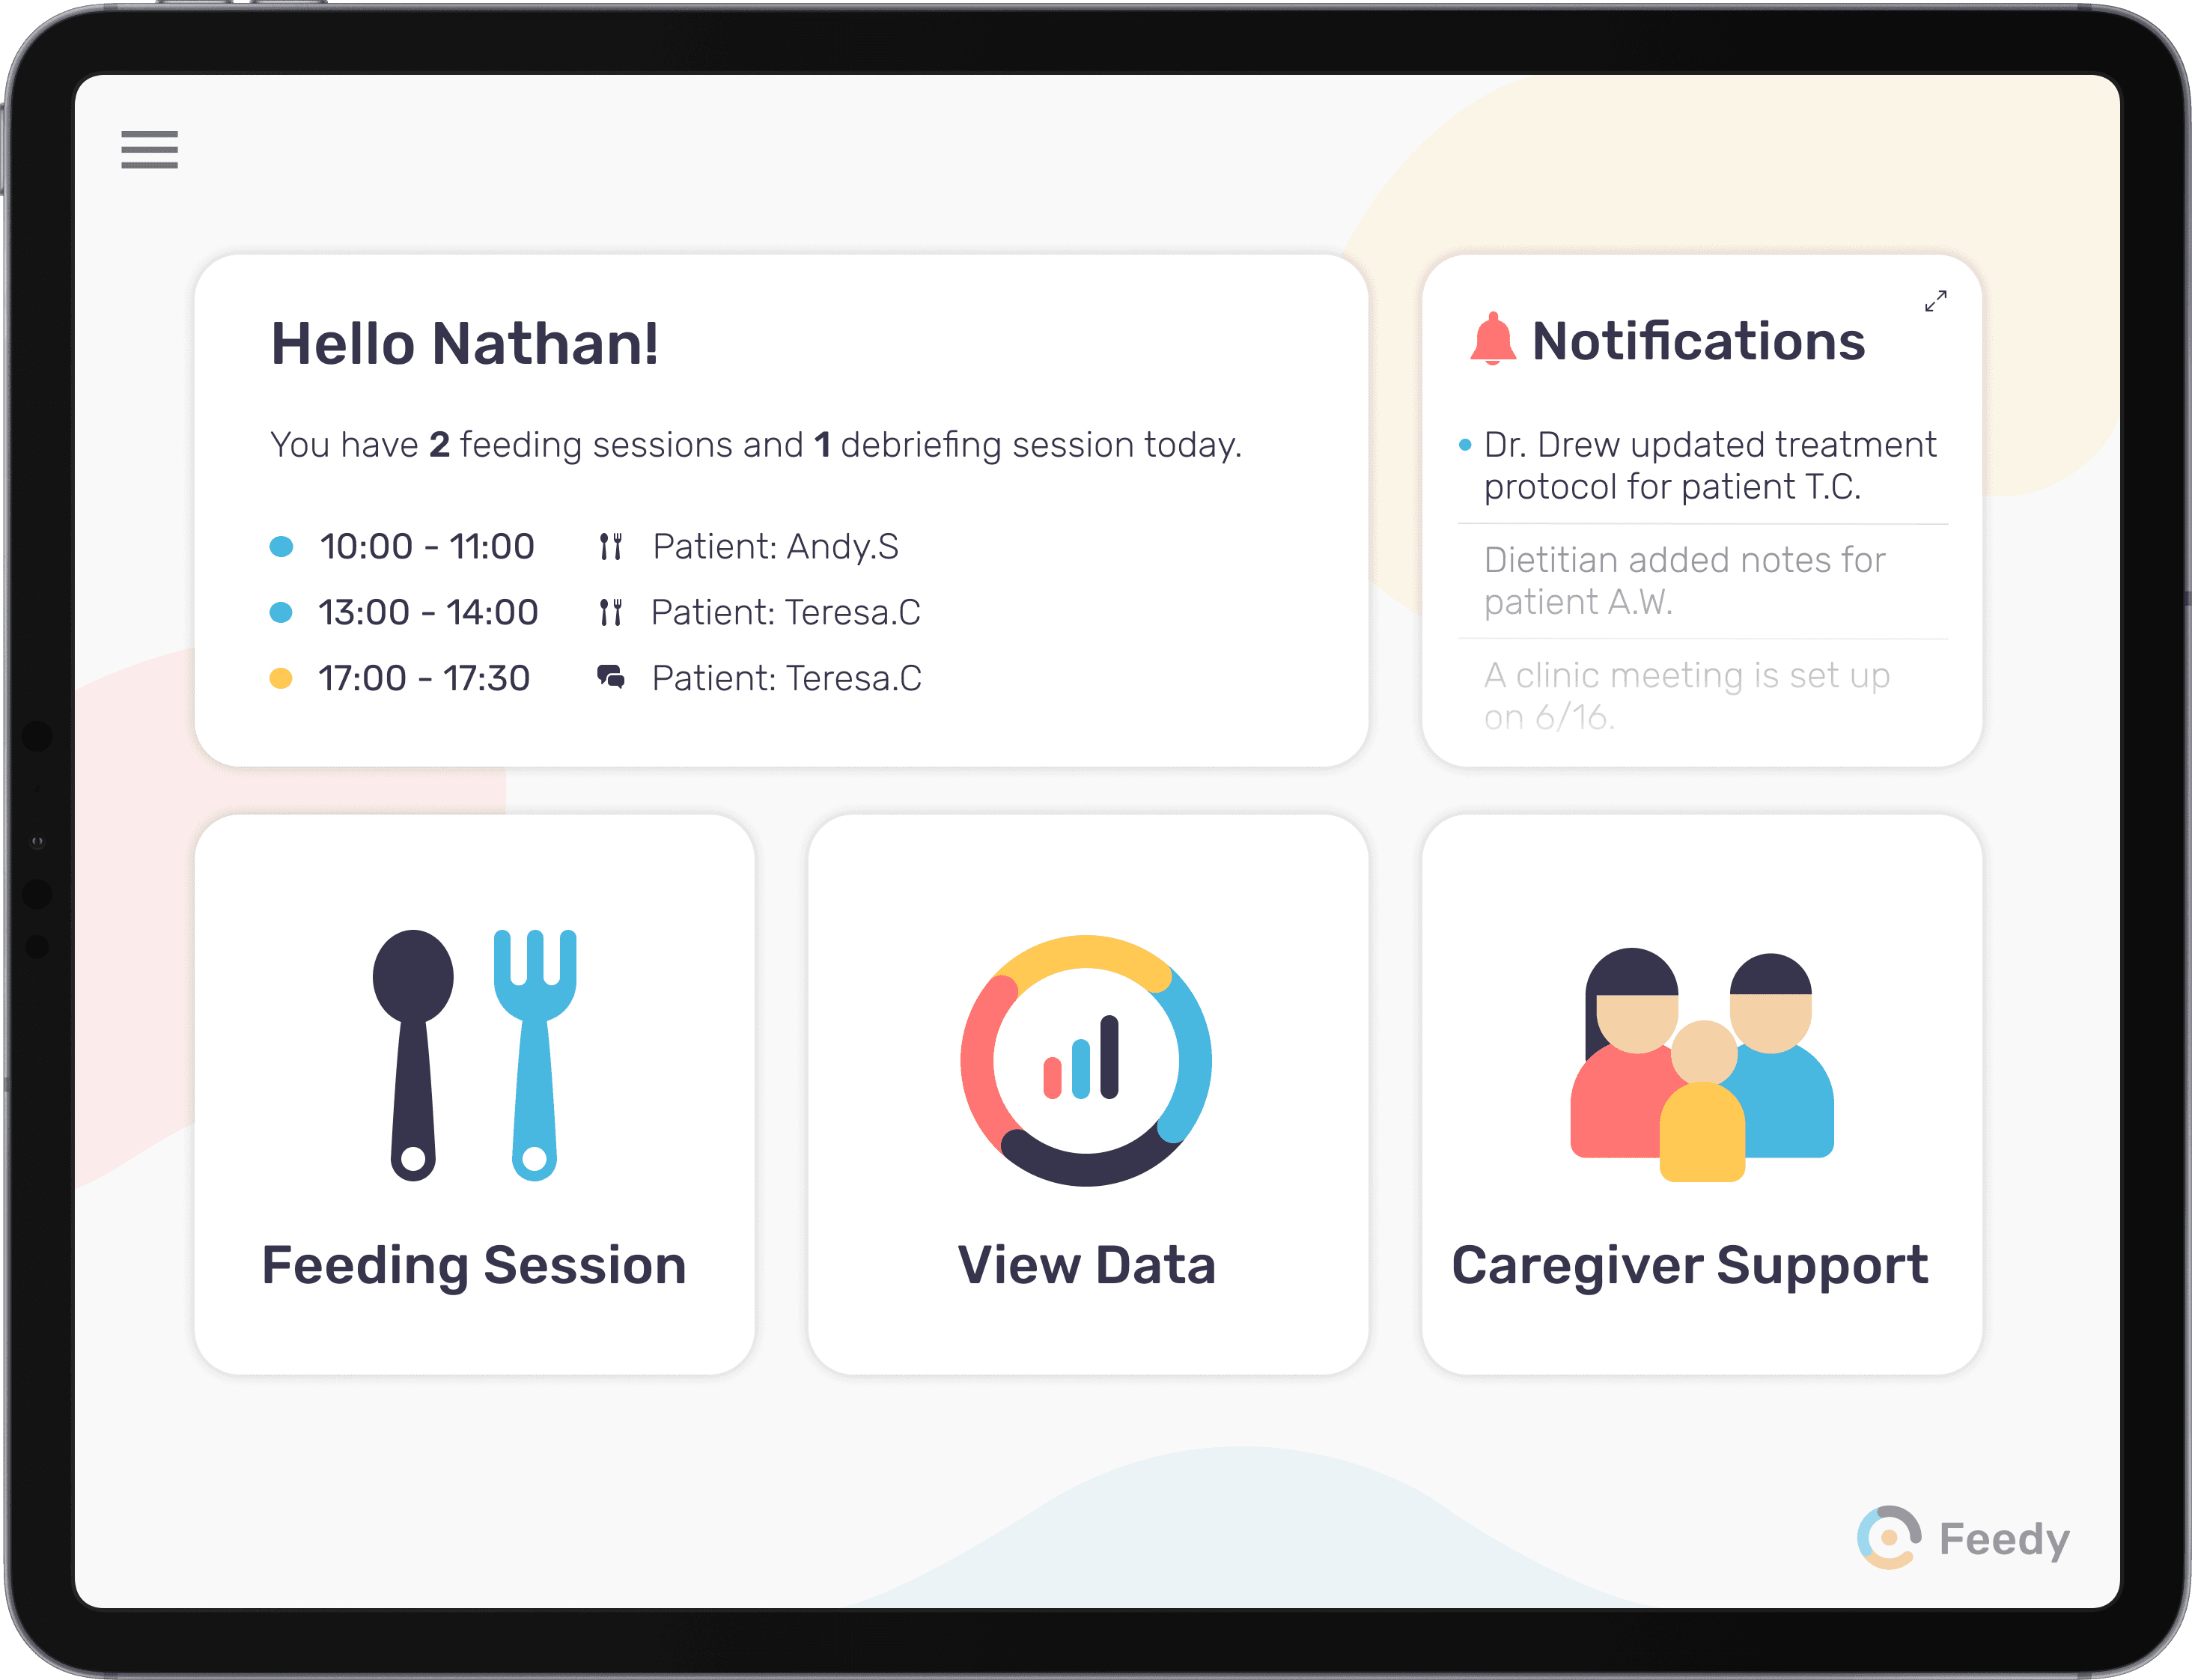
Dashboard

Dashboard

Dashboard
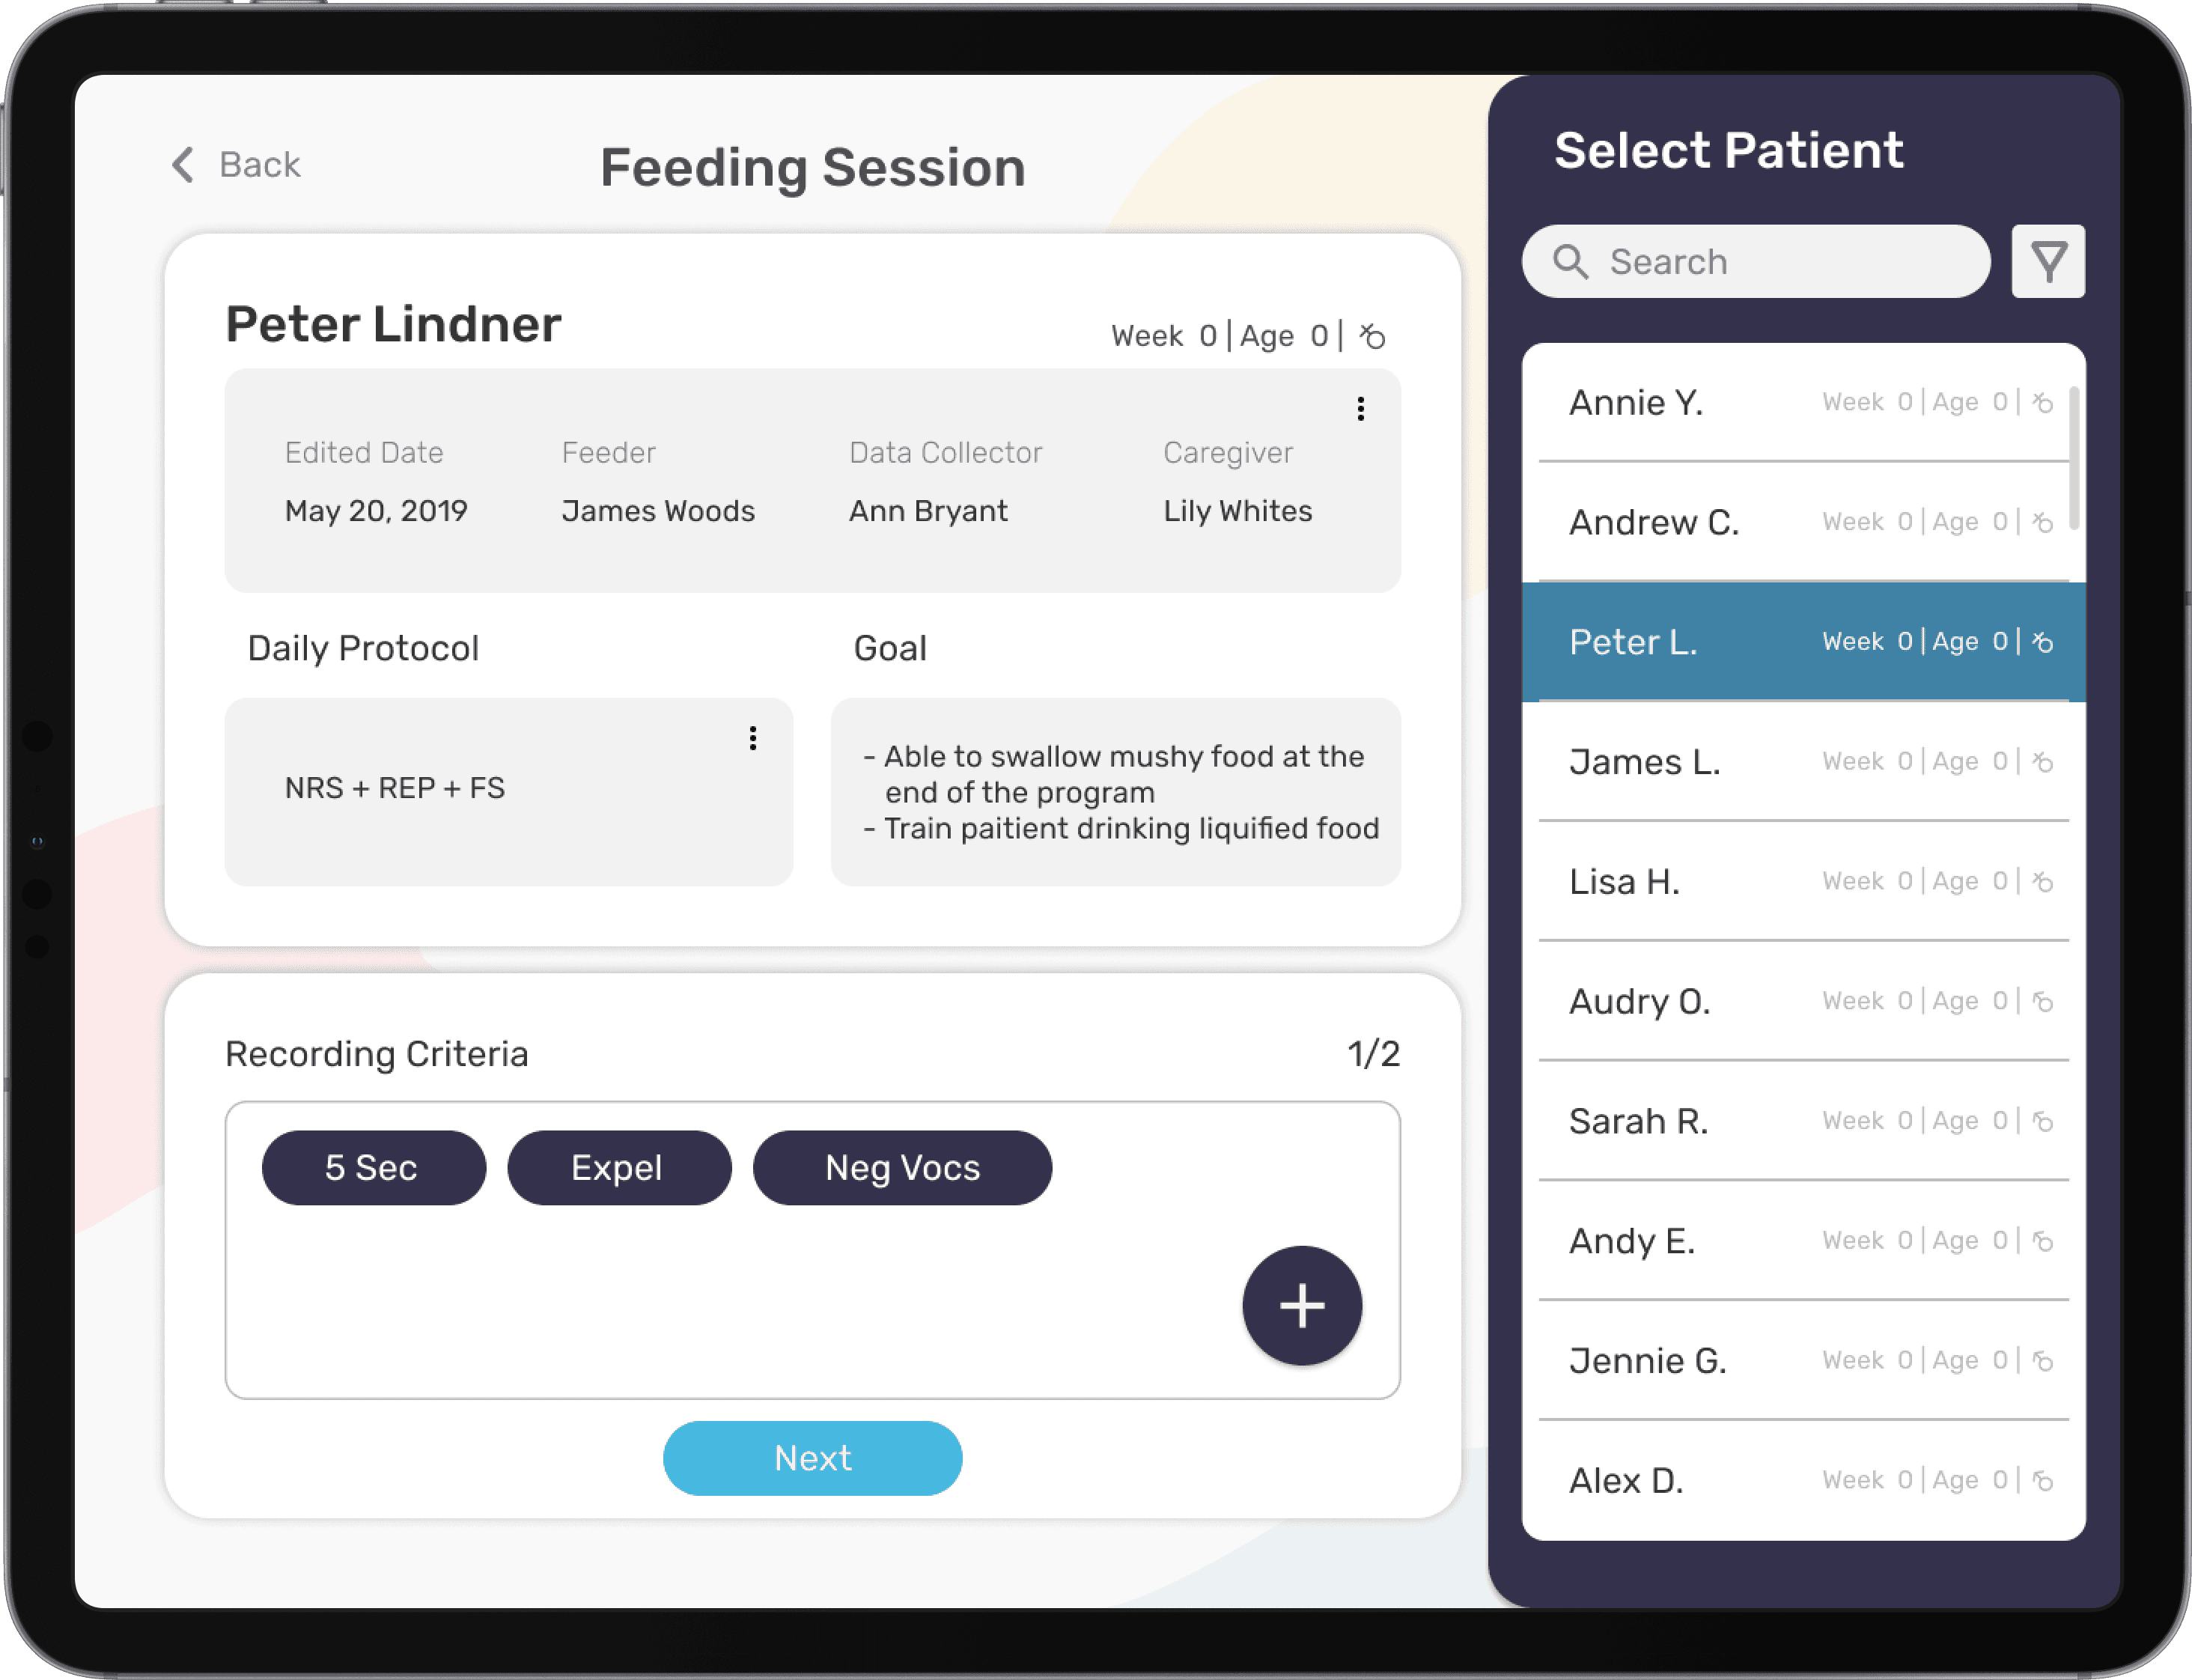
Feeding Session (Add Behavior)

Feeding Session (Add Behavior)

Feeding Session (Add Behavior)

Feeding Session (Record Food Weight)

Feeding Session (Record Food Weight)

Feeding Session (Record Food Weight)
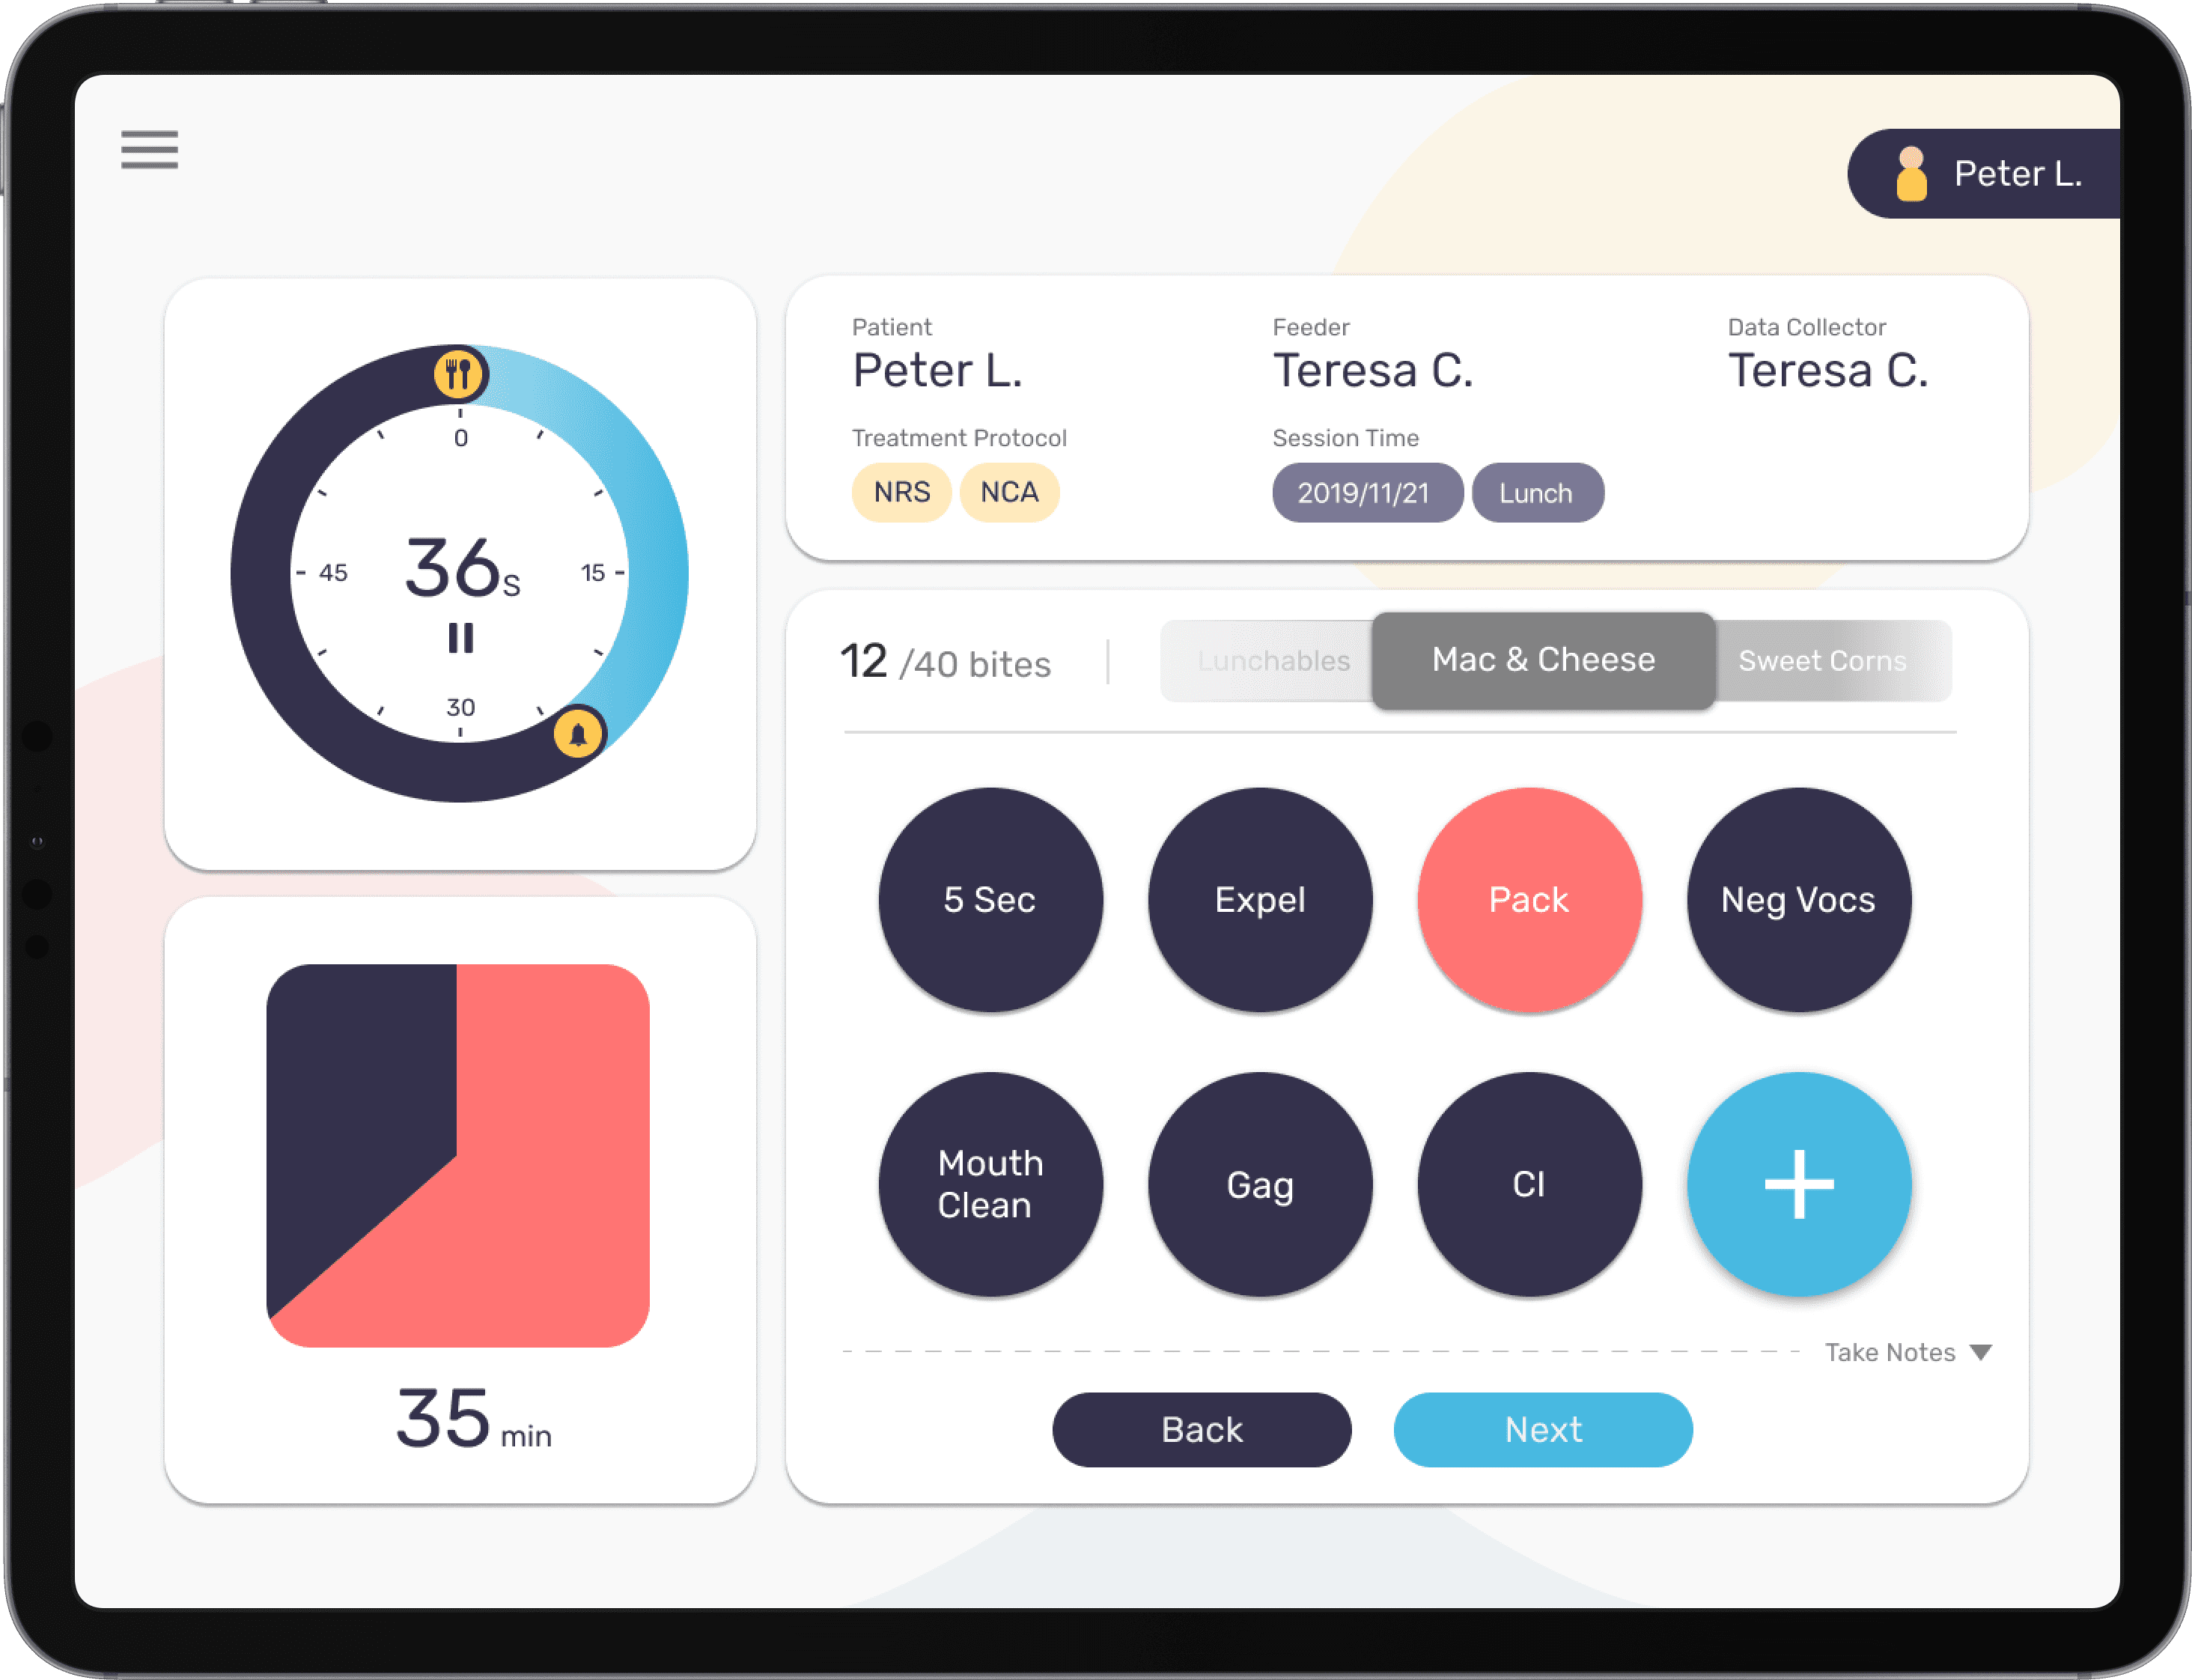
Behavioral Data Collection

Behavioral Data Collection

Behavioral Data Collection
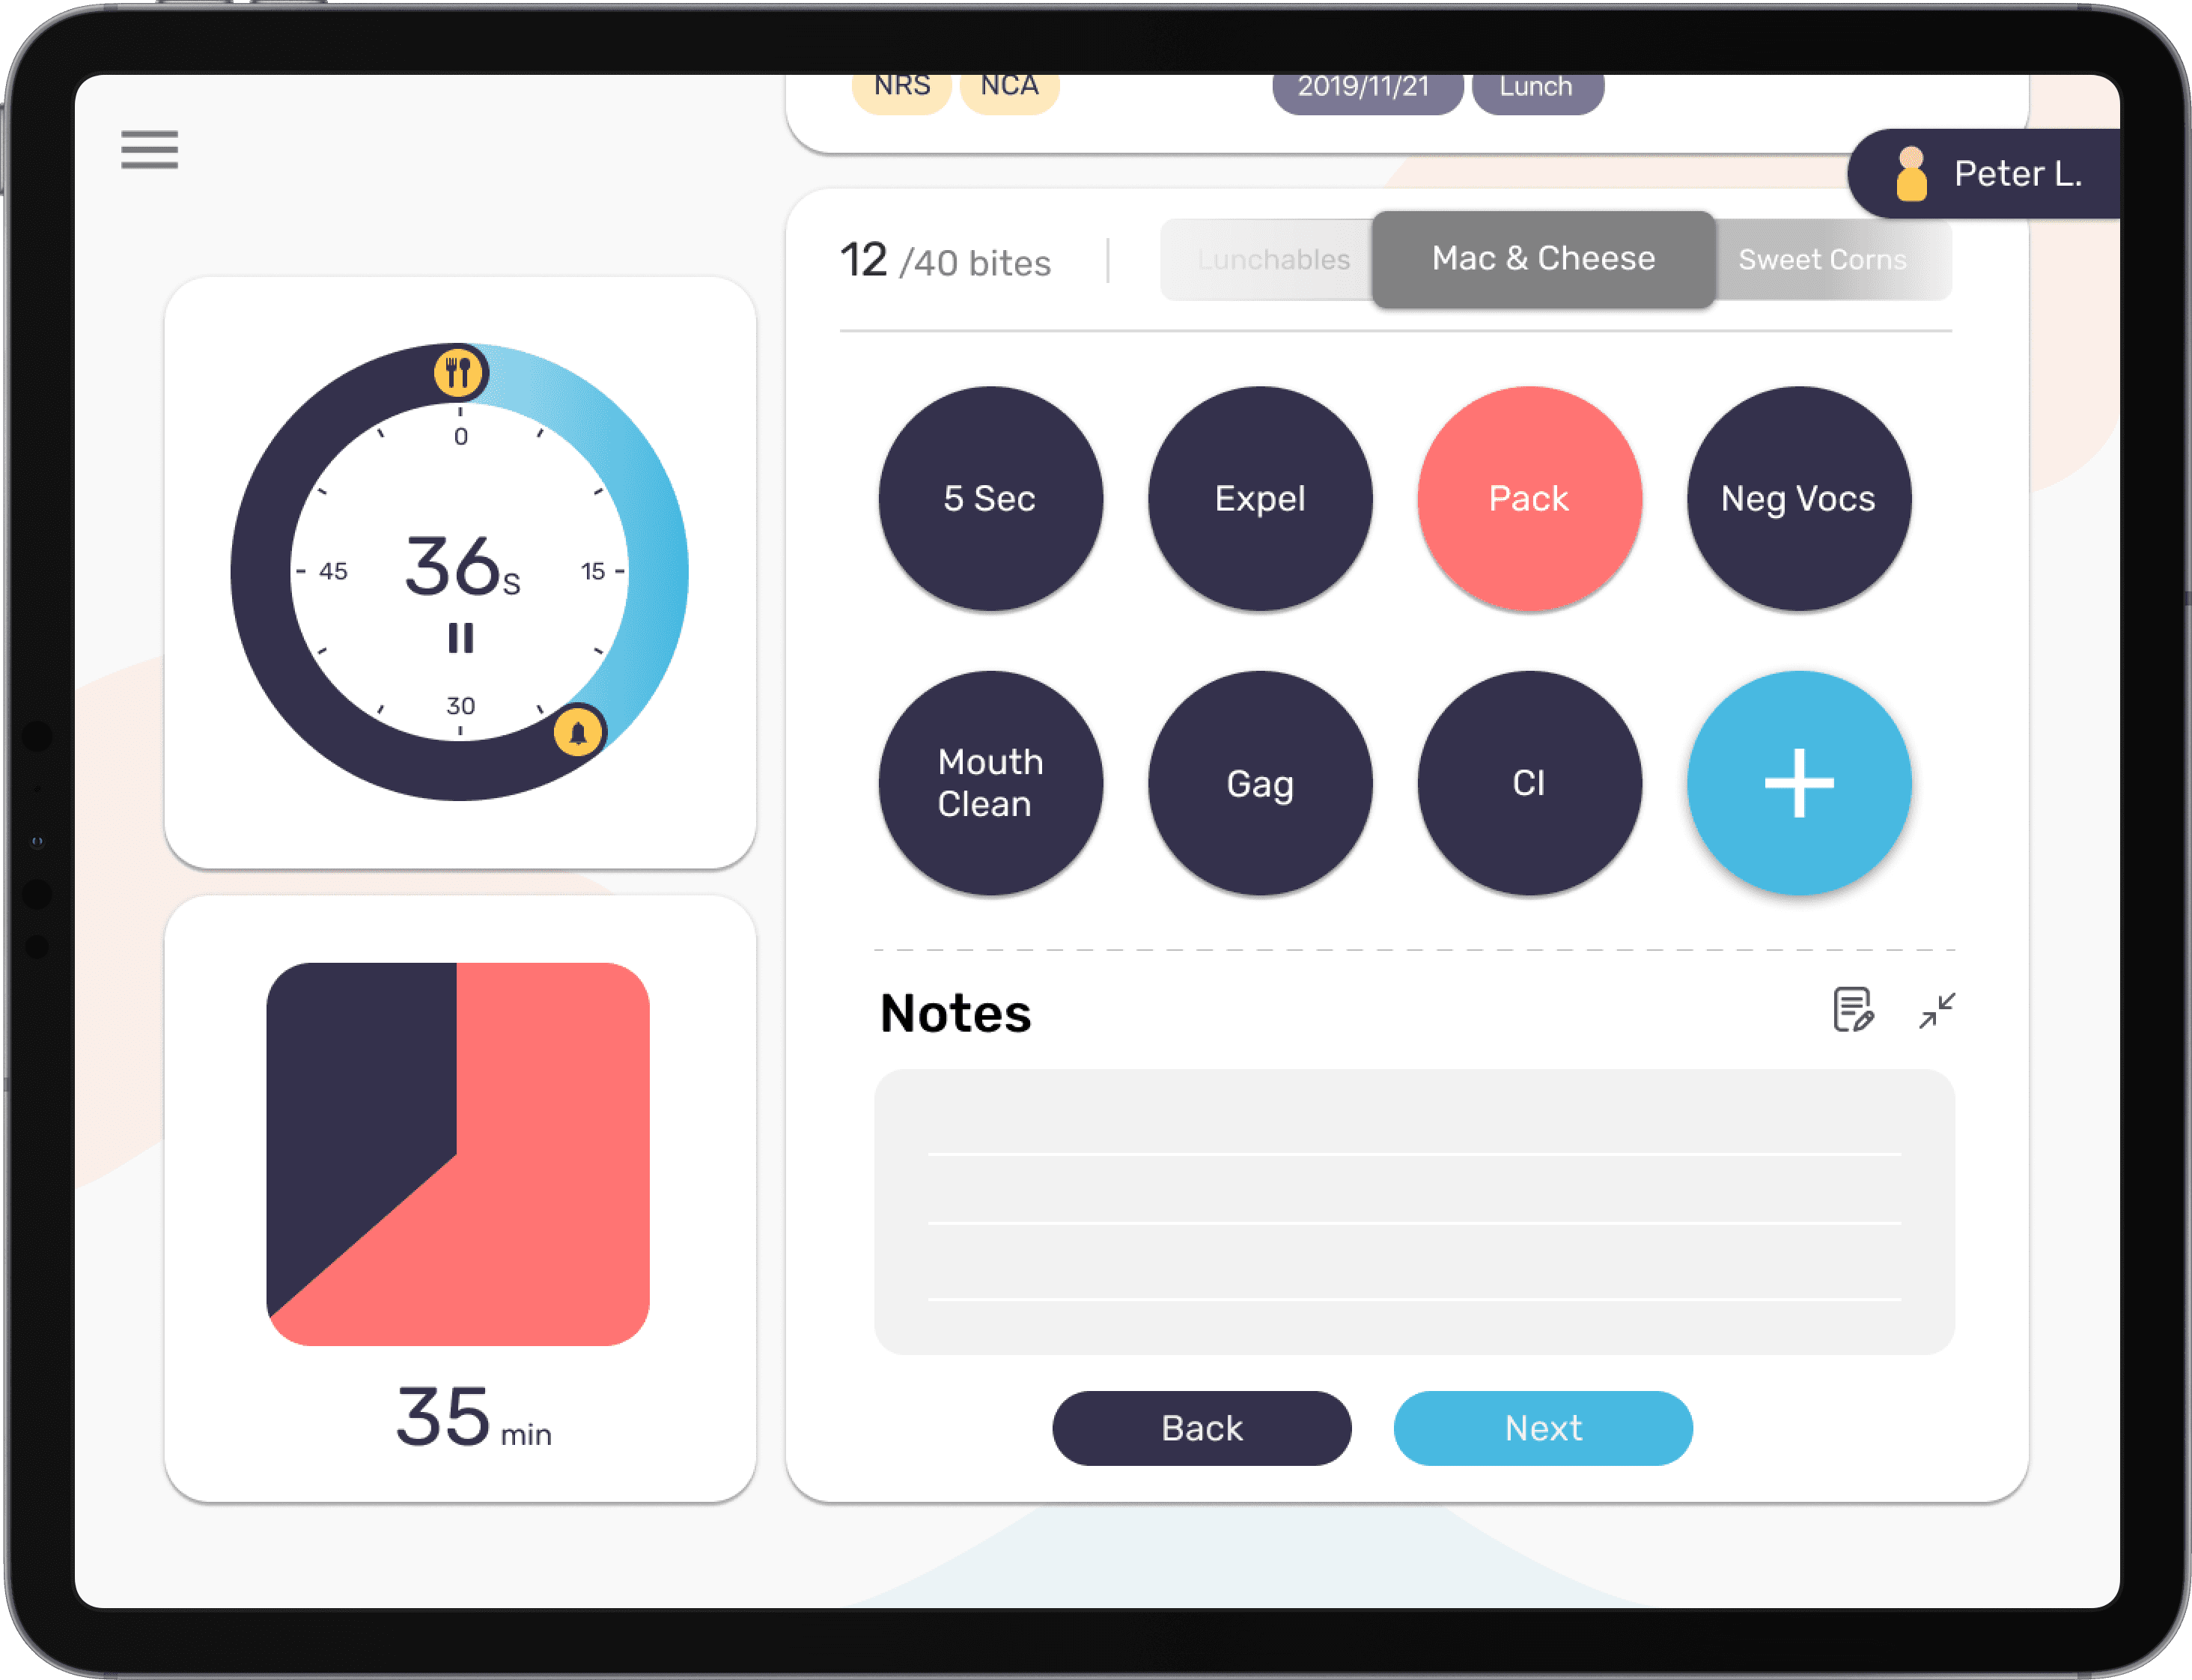
Behavioral Data Collection (Notes)

Behavioral Data Collection (Notes)

Behavioral Data Collection (Notes)
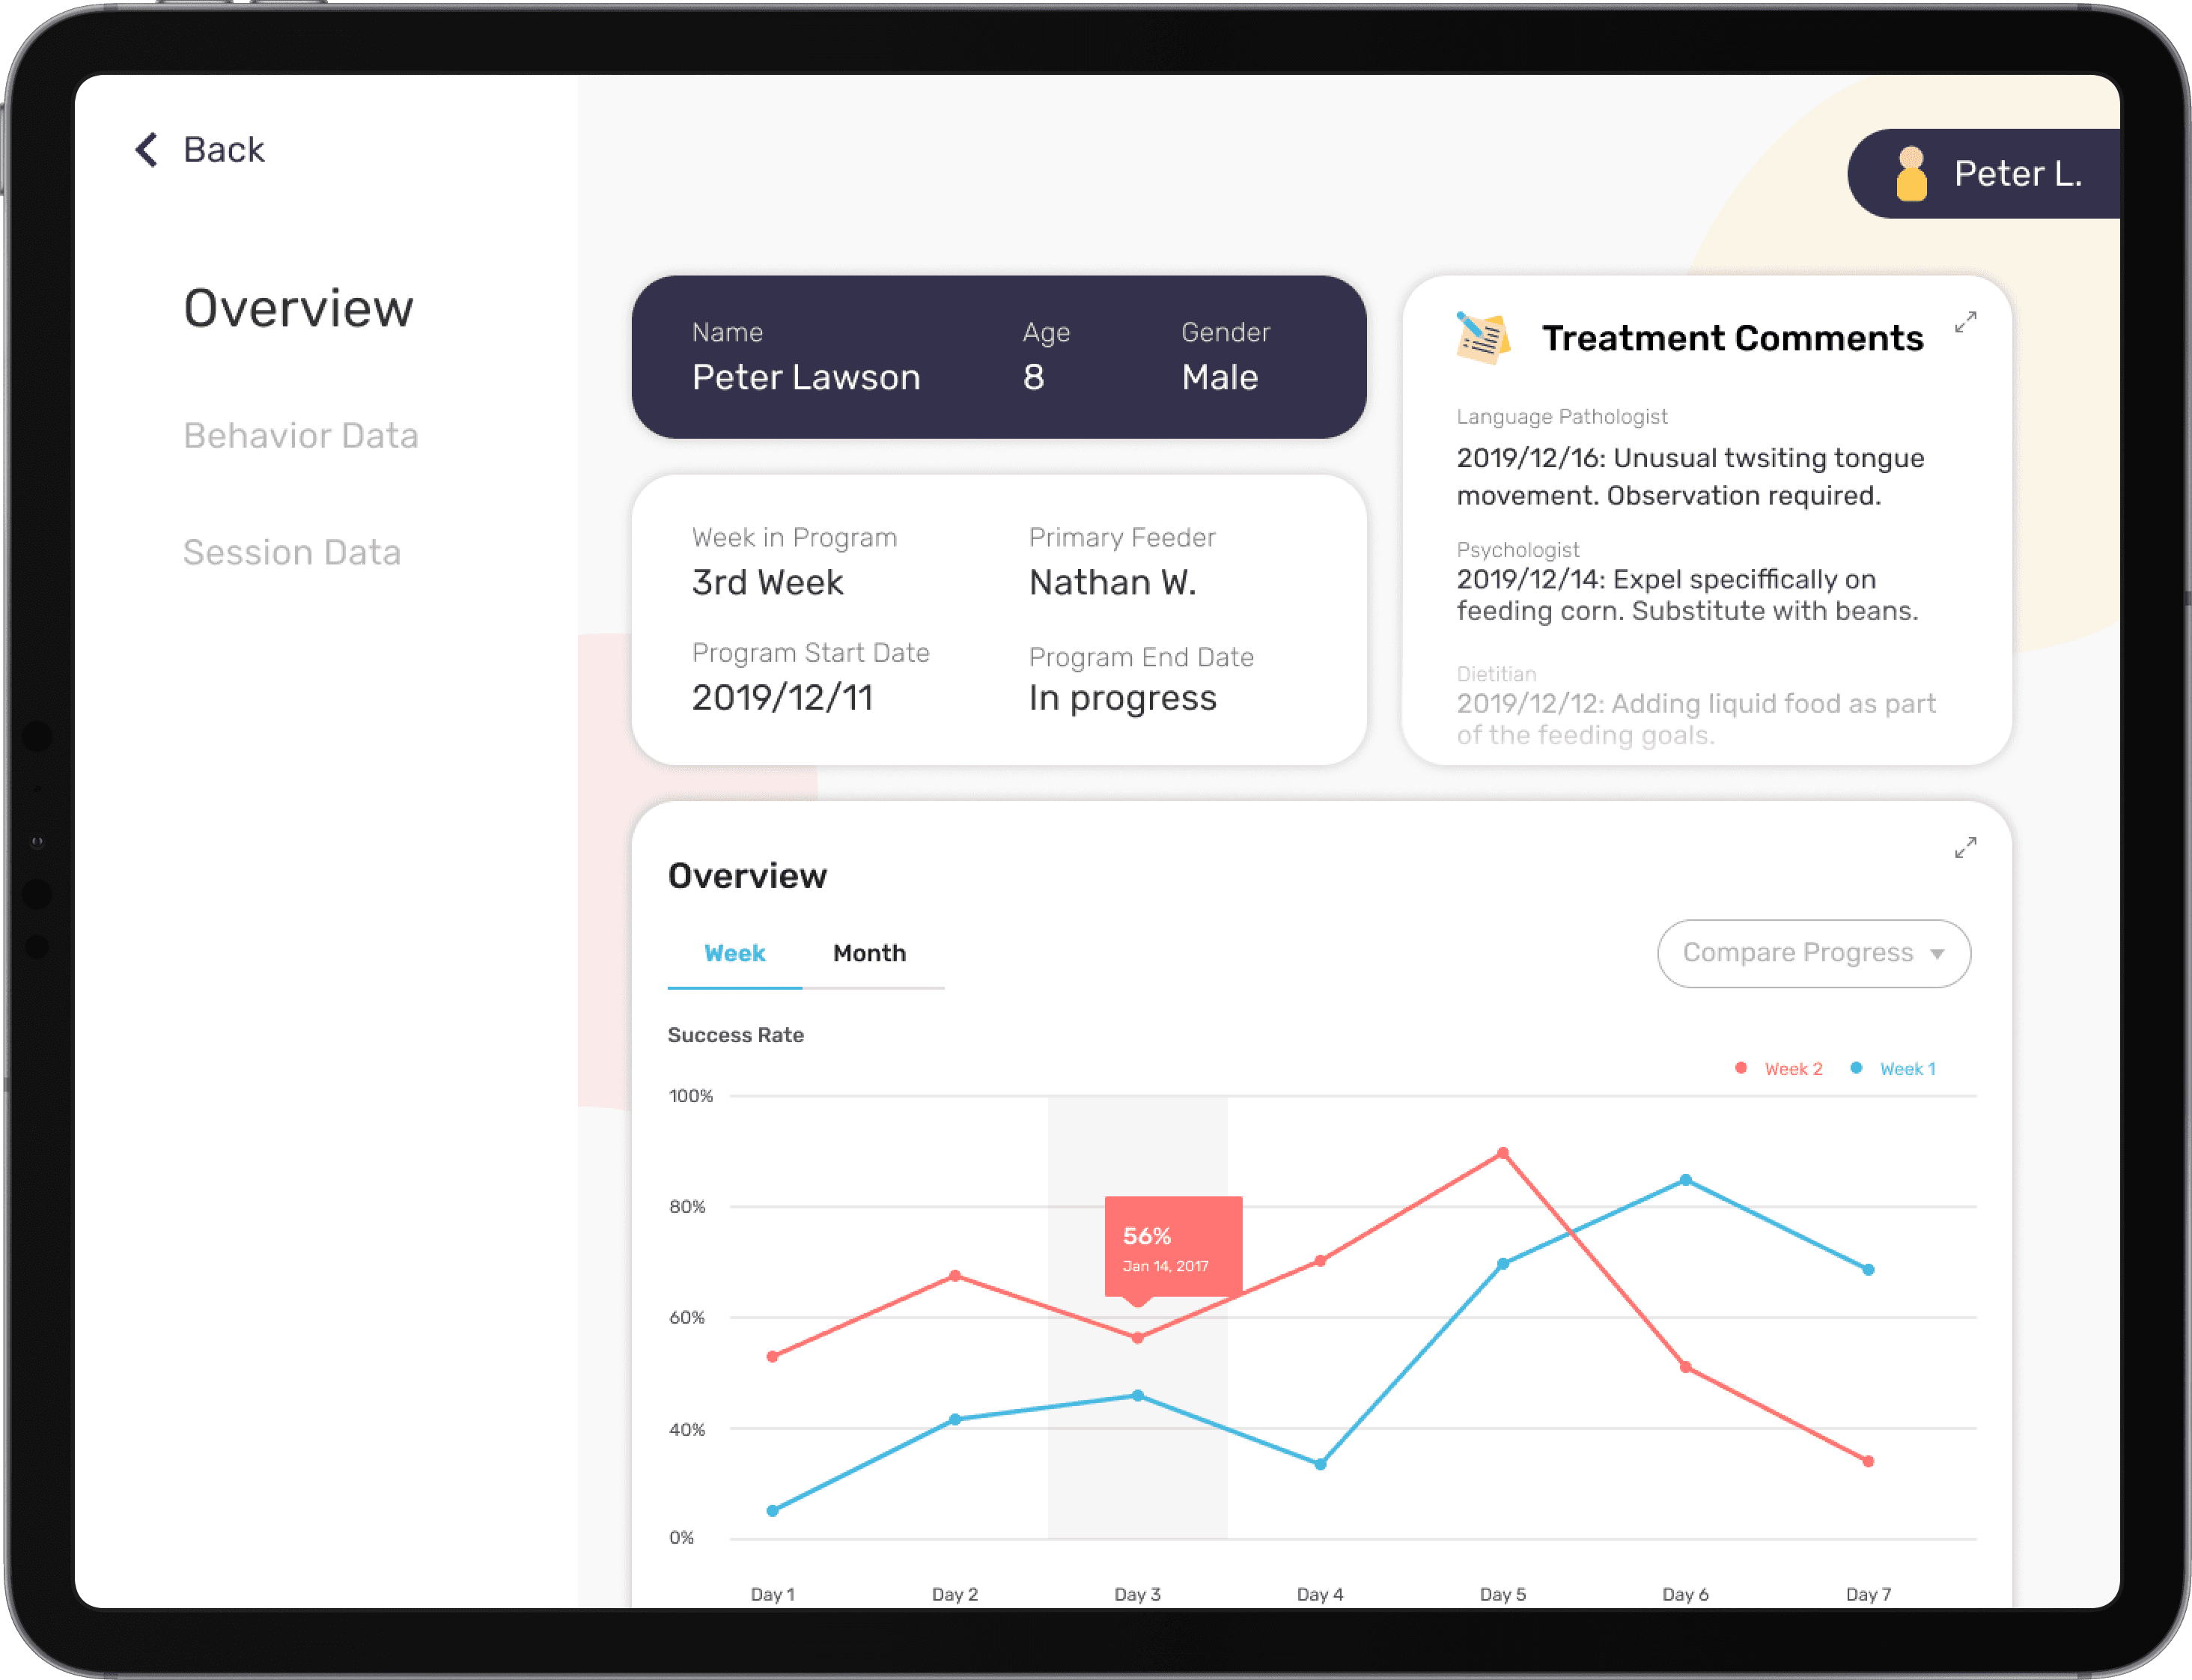
Patient Data (Overview)

Patient Data (Overview)

Patient Data (Overview)
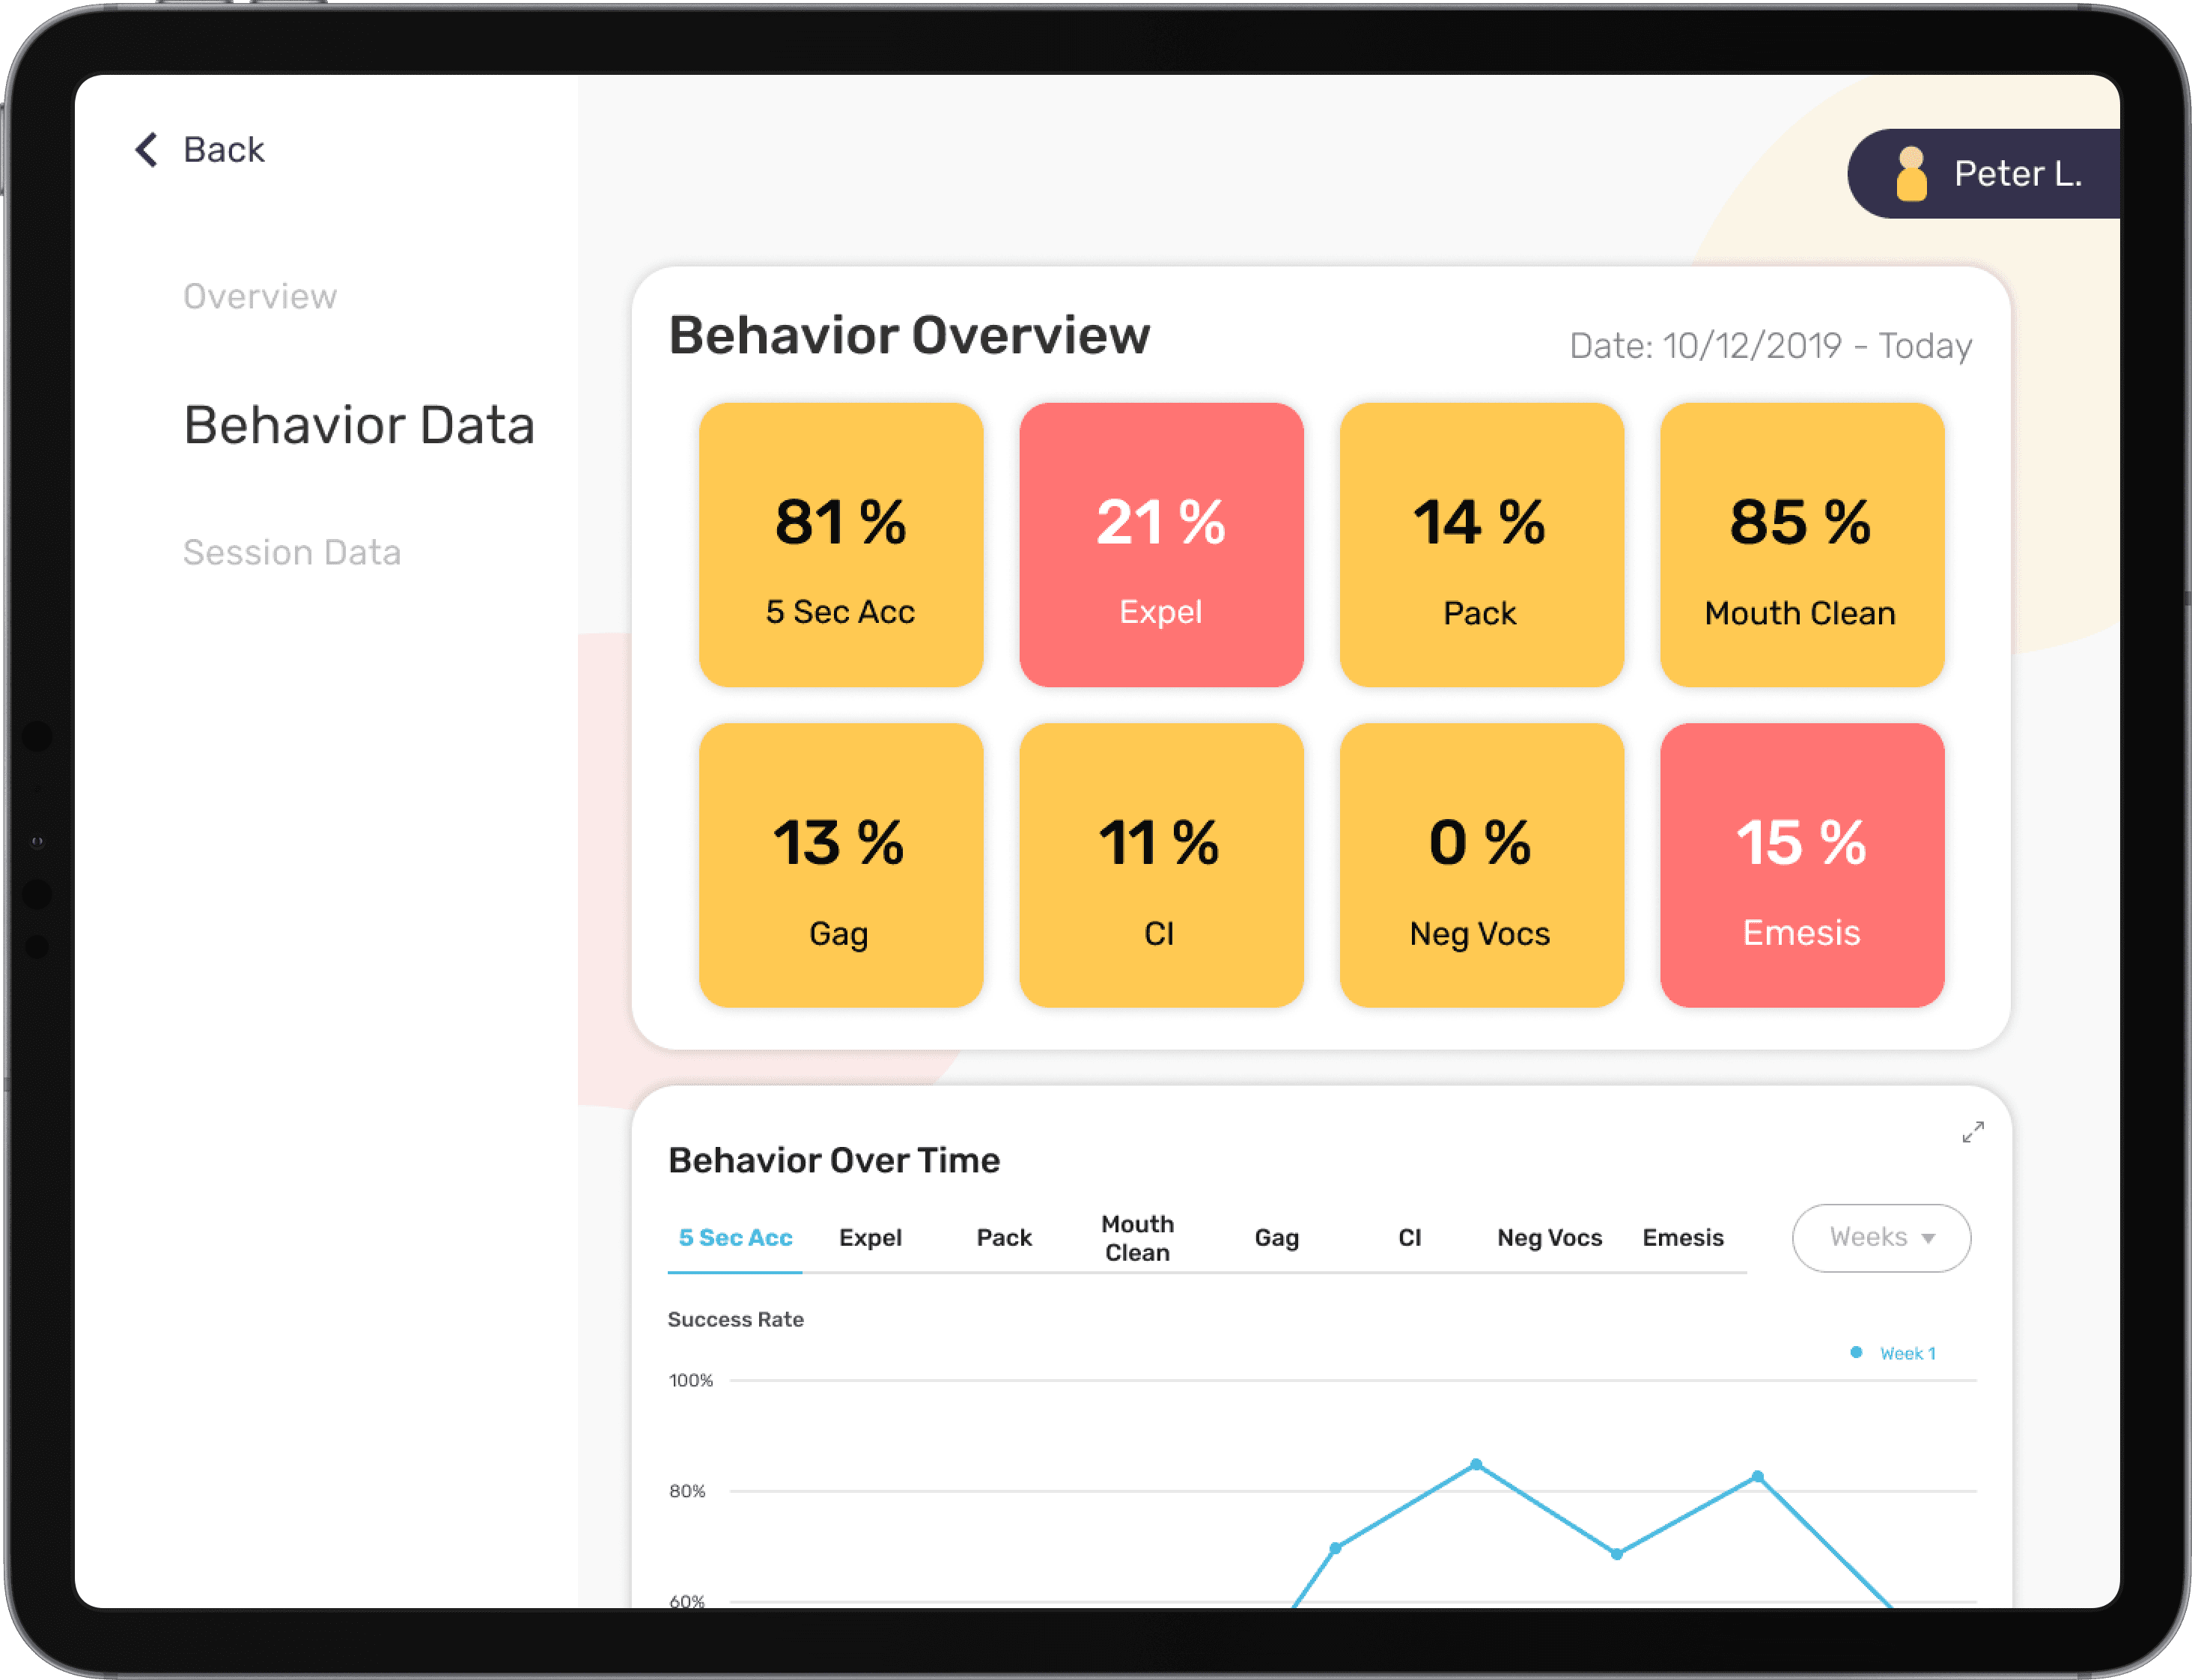
Patient Data (Behavioral Data)

Patient Data (Behavioral Data)

Patient Data (Behavioral Data)
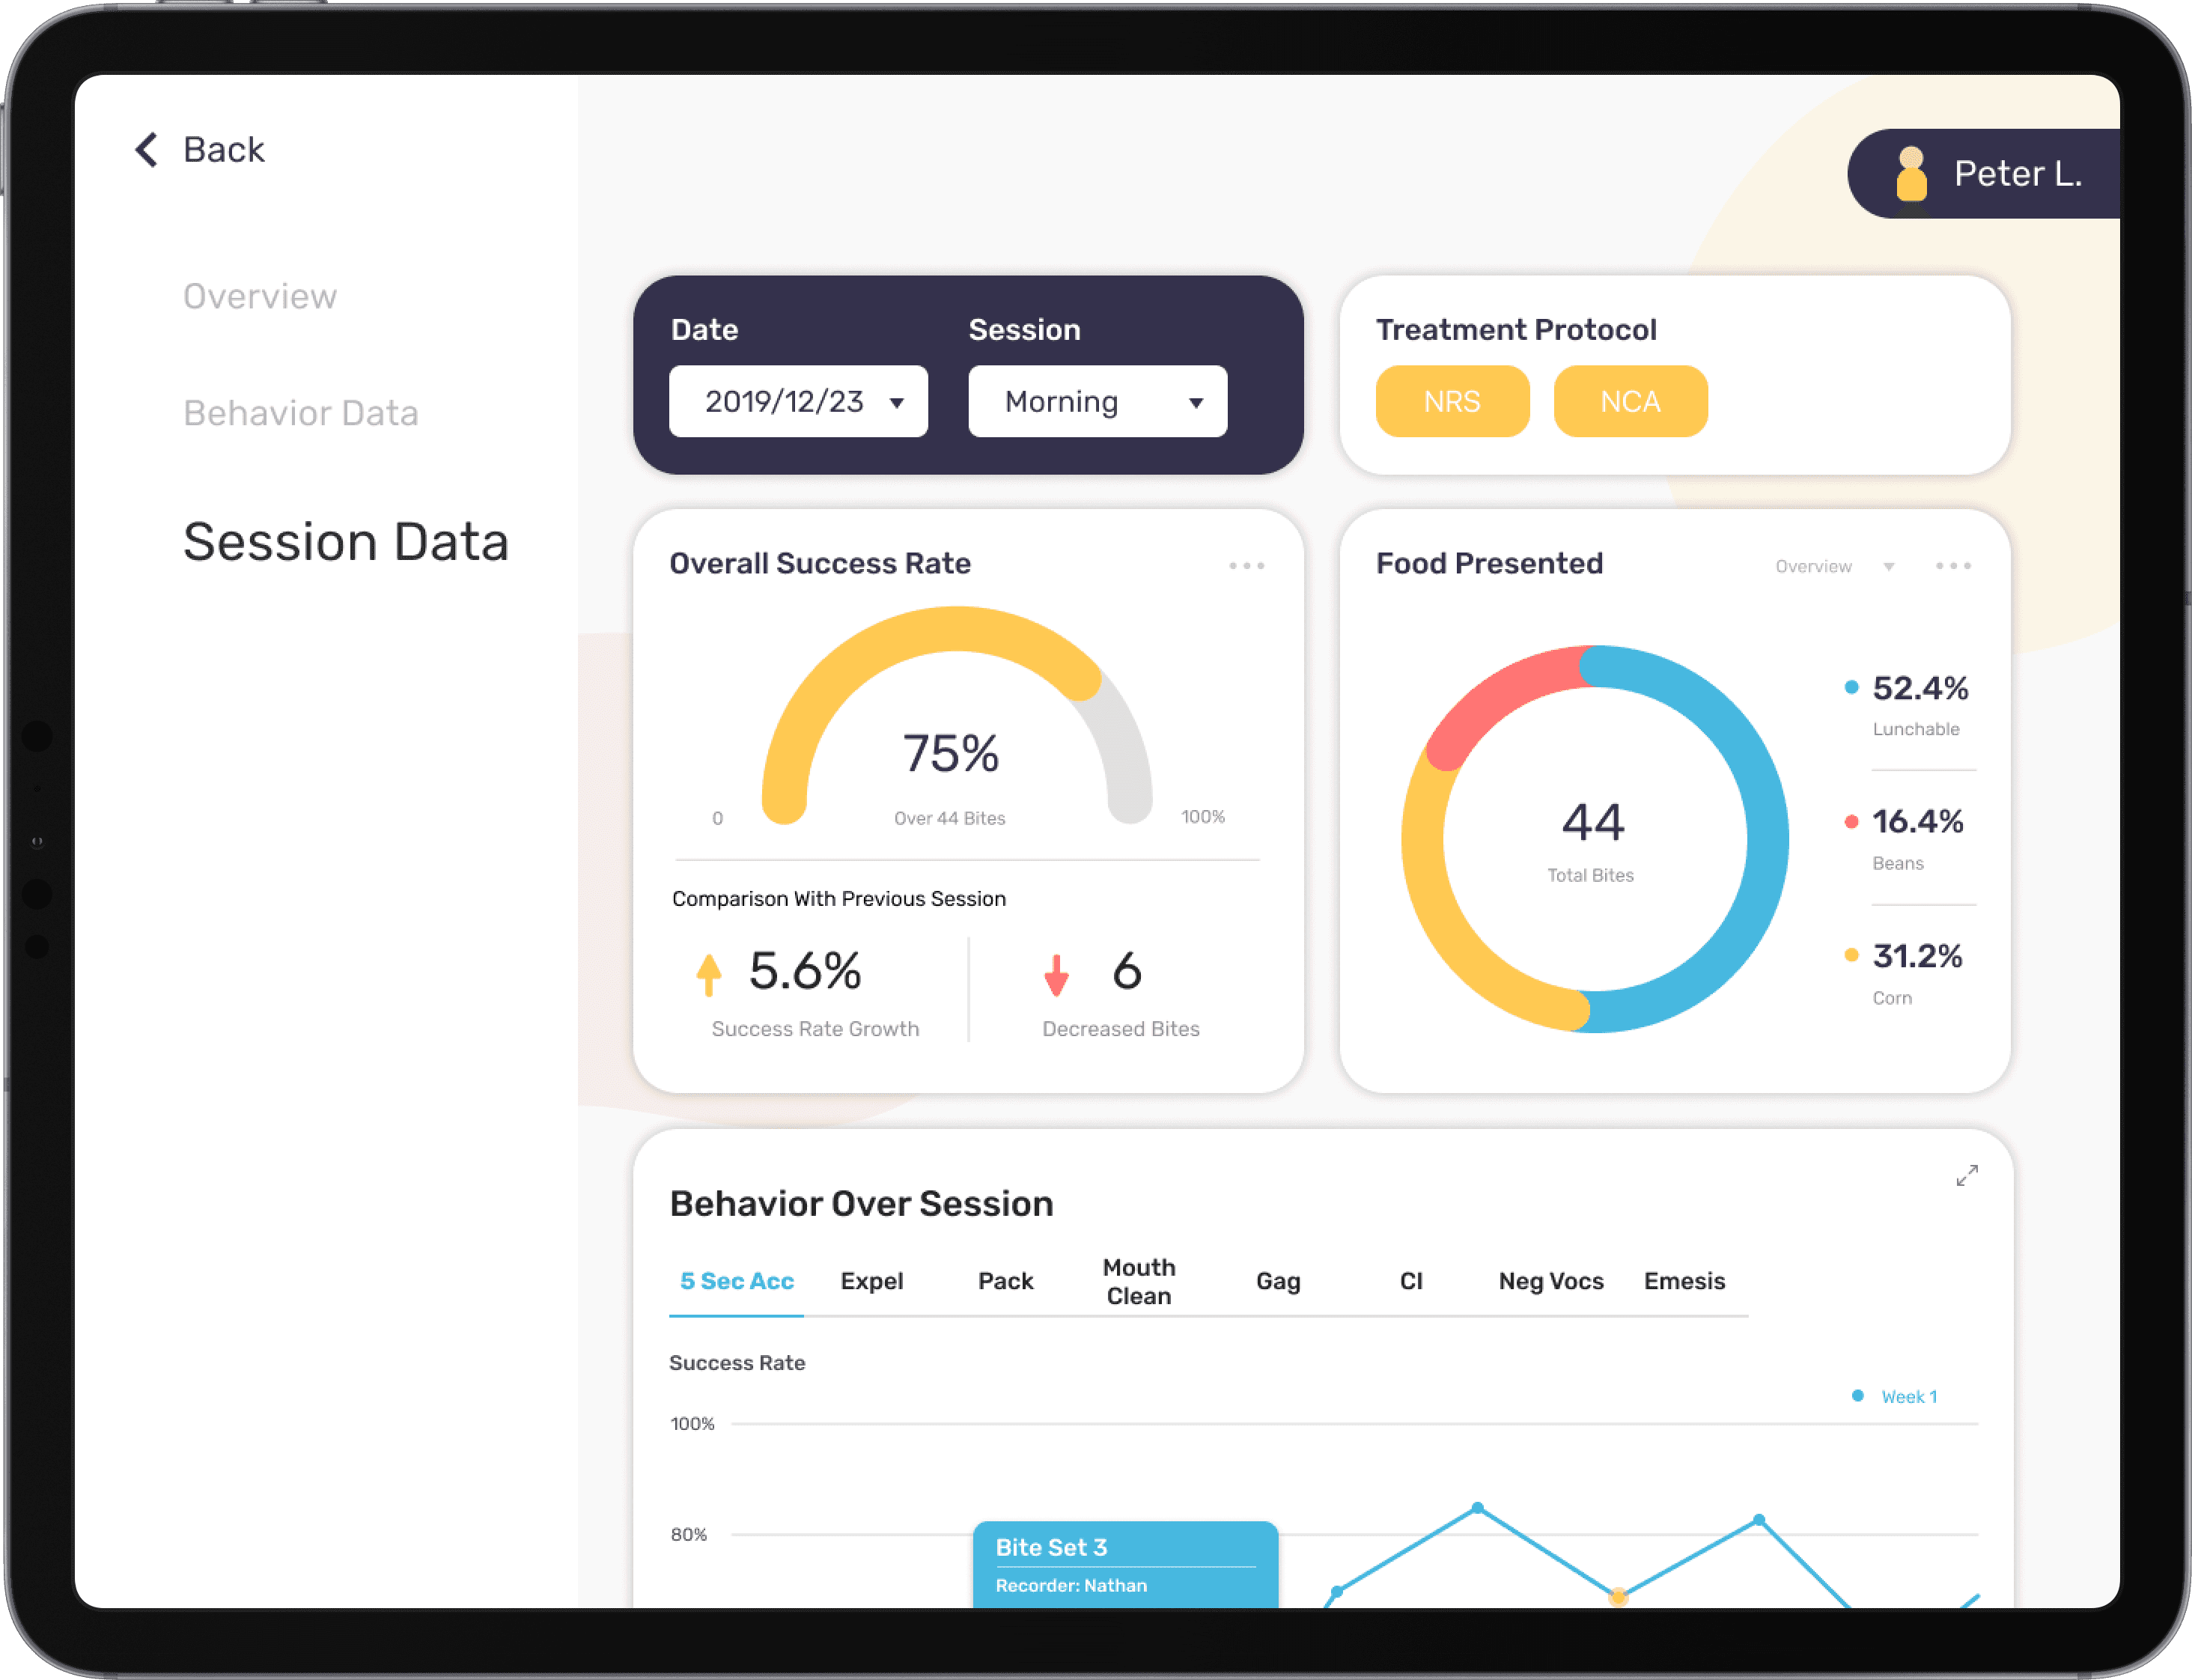
Patient Data (Session Data)

Patient Data (Session Data)

Patient Data (Session Data)
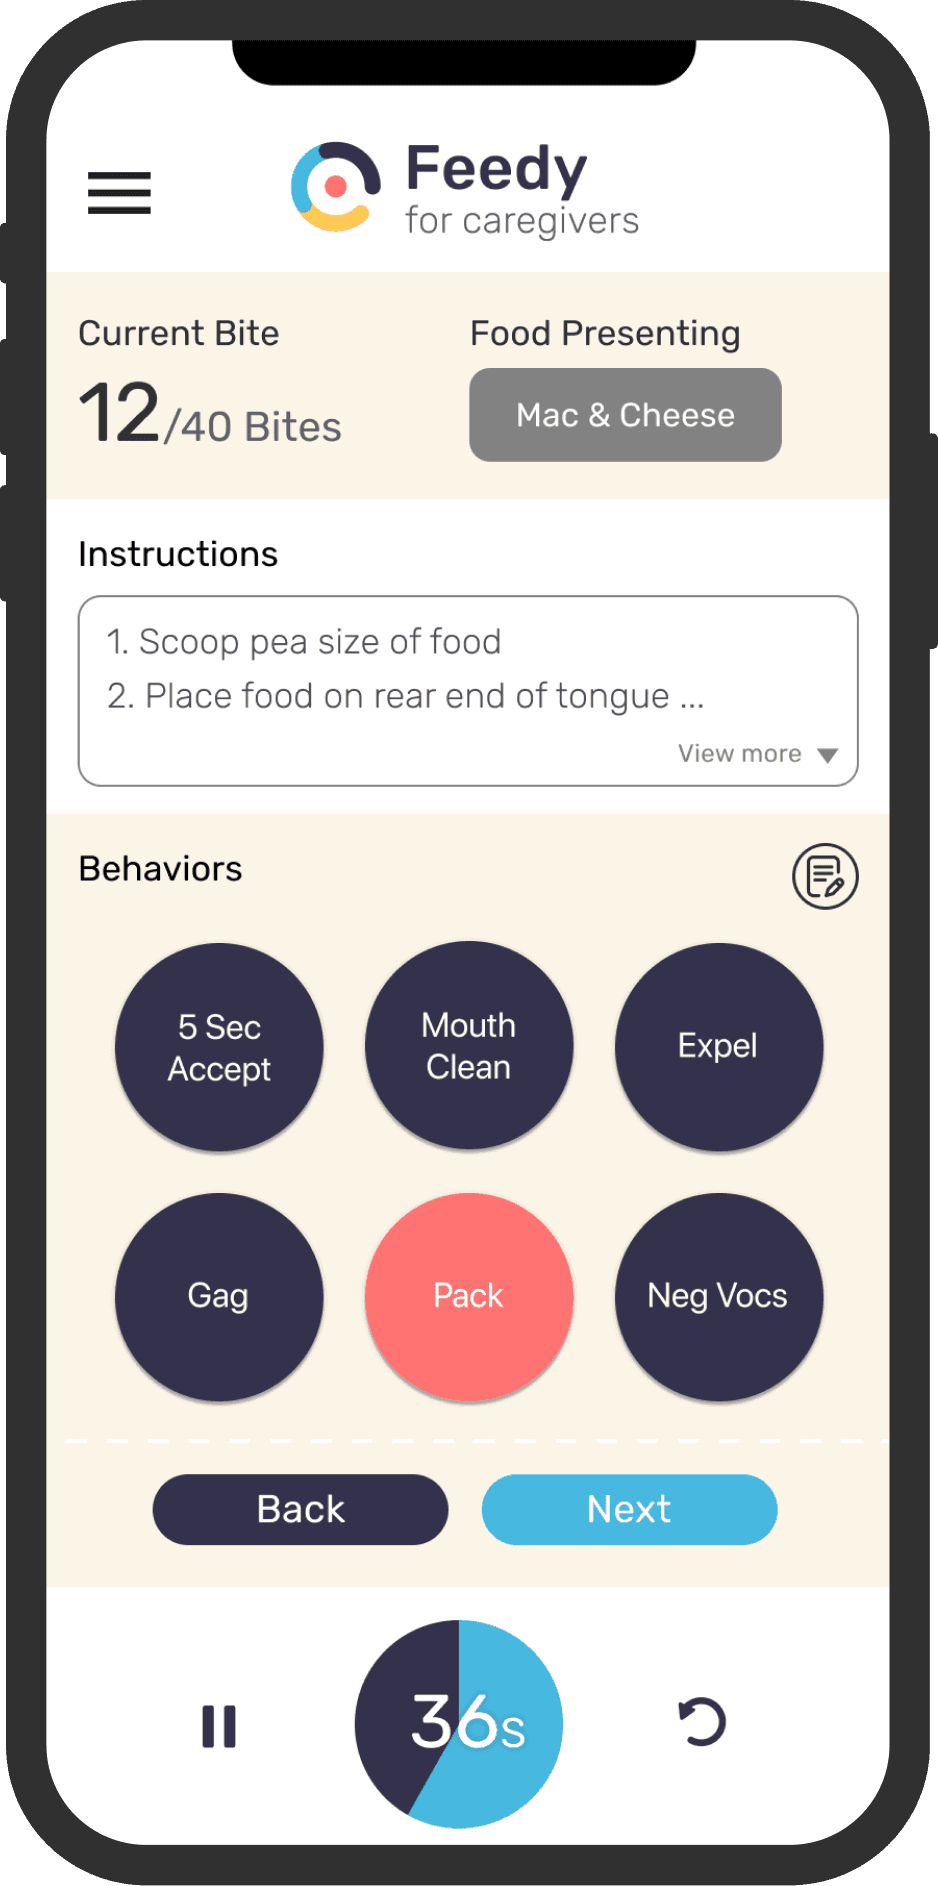
Caregiver Mobile App (Collect Home Data)

Caregiver Mobile App (Collect Home Data)

Caregiver Mobile App (Collect Home Data)
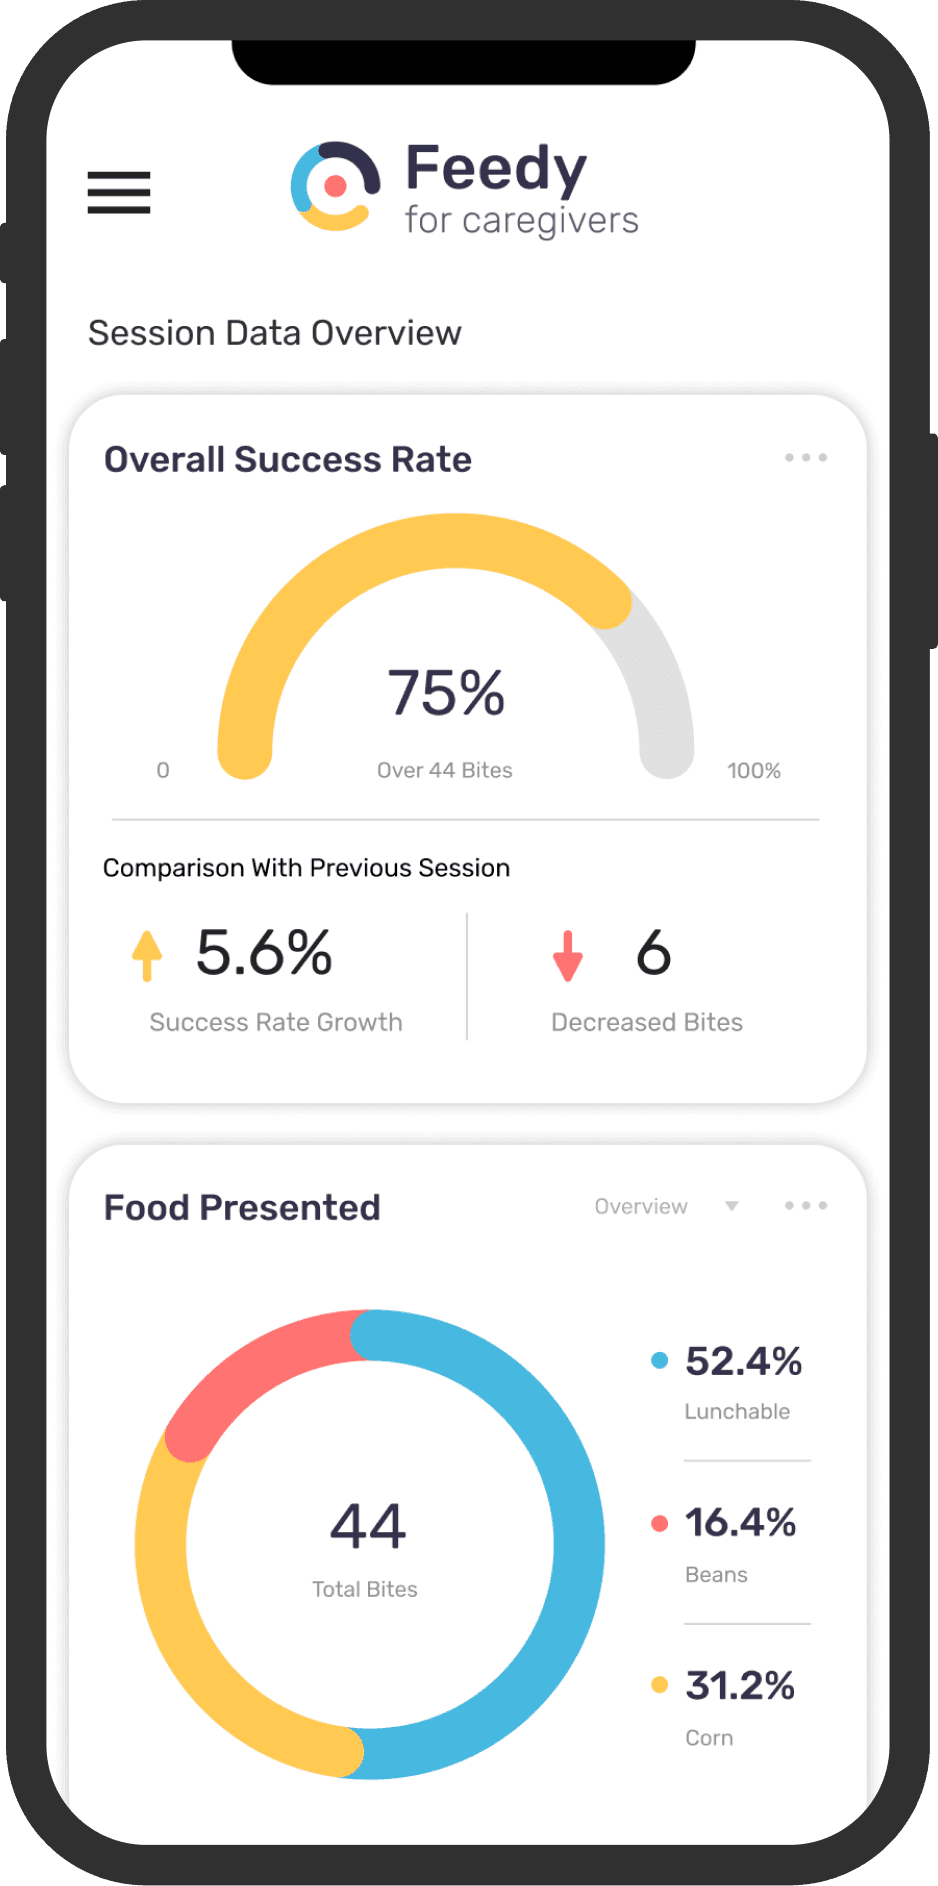
Caregiver Mobile App (View Data Shared by Clinicians)

Caregiver Mobile App (View Data Shared by Clinicians)

Caregiver Mobile App (View Data Shared by Clinicians)
